. 2017 Apr 20;6:e23326. doi: 10.7554/eLife.23326

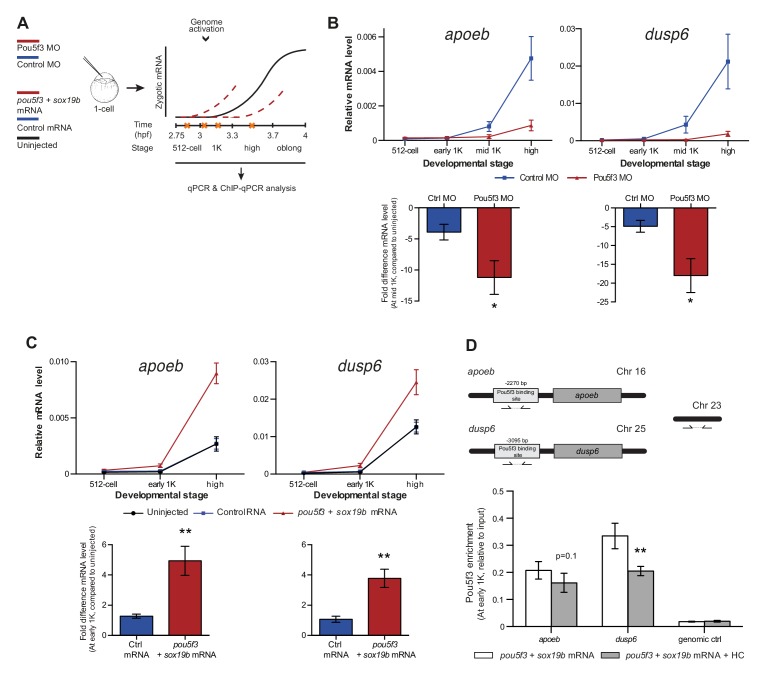
Figure 5. Direct experimental evidence for the competition model using endogenous genes and transcription factors.

(A) Schematic representation of experimental procedure. Pou5f3 levels were decreased by injecting a morpholino, or increased by injecting pou5f3 mRNA (in combination with sox19b mRNA) into the cell of 1-cell embryos. Controls used were a dead-end morpholino and gfp mRNA, respectively. qPCR and ChIP-qPCR analysis was carried out at stages around genome activation. Orange crosses represent the timing of stages used for the analysis. (B) Expression of apoeb and dusp6 was analyzed by qPCR at 512-cell, early 1K, mid 1K and high stage in control and Pou5f3 morpholino-injected embryos. The data in the bar graphs focus on the mid 1K stage. Error bars represent SEM (n ≥ 4). *p<0.05 (two-tailed Student’s t-test, compared to control MO). (C) Expression of apoeb and dusp6 was analyzed by qPCR at 512-cell, early 1K and high stage in uninjected embryos, embryos injected with control mRNA and embryos injected with pou5f3 and sox19b mRNA. Bar graphs focus on the early 1K stage. Error bars represent SEM (n ≥ 4). **p<0.01 (two-tailed Student’s t-test, compared to control mRNA). (D) Binding of Pou5f3 to its respective binding sites for apoeb and dusp6 (Leichsenring et al., 2013) and control region was analyzed by ChIP-qPCR at the early 1K stage in embryos injected with pou5f3 + sox19b mRNA or pou5f3 + sox19b mRNA plus histone cocktail. Enrichment of pulled-down fragments was normalized to input. Location of primer sets in respect to the transcription start-site used for ChIP-qPCR analysis are indicated by arrows. A genome control region on chromosome 23 was also used. Error bars represent SEM (n = 5). **p<0.01 (two-tailed Student’s t-test ratio paired, compared to pou5f3 + sox19b mRNA-injected embryos). In B and C, mRNA levels are normalized to the expression of eif4g2α.

DOI: http://dx.doi.org/10.7554/eLife.23326.016

Figure 5.

Figure 5—figure supplement 1. Reducing transcription factor levels delays the onset of transcription.

Figure 5—figure supplement 1.

(A) Pou5f3 morpholino validation. Brightfield images of embryos that were injected with control or Pou5f3 morpholino. Embryos injected with Pou5f3 morpholino arrested at sphere or dome stage, as reported previously (Burgess et al., 2002). Scale bar, 250 μm. Western blot of embryos injected with 50 ng pou5f3-2xHA mRNA alone or in combination with 6 ng Pou5f3 moprholino. As expected, the morpholino reduces the expression of Pou5f3. (B) We injected embryos with Pou5f3 morpholino and analyzed the effect on transcription. Shown are the fold changes in relative expression levels of Pou5f3-morpholino-injected embryos compared to control morpholino-injected embryos at high stage for Pou5f3 targets apoeb, dusp6, klf17, irx7, and klf2b, and non-Pou5f3 targets sox19a, grhl3 and gadd45bb. Reduction of Pou5f3 results in decreased transcription for all Pou5f3 target genes analyzed at high stage, confirming that they are regulated by Pou5f3. Non-targets were not affected. Error bars represent SEM (n = 4). n.s. p>0.05; *p<0.05; **p<0.01; ***p<0.001 (two-tailed Student’s t-test, compared to control morpholino). (C) Expression of klf17, irx7 and klf2b was analyzed by qPCR at 512-cell, early 1K, mid 1K and high stage in control and Pou5f3 morpholino-injected embryos. Bar graphs focus on mid 1K stage. Error bars represent SEM (n ≥ 4). **p<0.01; **p<0.001 (two-tailed Student’s t-test, compared to control morpholino). (D) Western blot analysis of embryos injected with sox19b-2xHA mRNA alone and in combination with 2 ng of Sox19b morpholino validate the effect of the Sox19b morpholino. (E) Expression of dusp6 was analyzed by qPCR at 512-cell, early 1K, mid 1K and high stage in control and Sox19b morpholino-injected embryos. dusp6 was selected for analysis because it is the only gene from our selected Pou5f3-target genes that is also regulated by SoxB1 (Lee et al., 2013). Error bars represent SEM (n ≥ 4). (F) Validation of FoxH1 target genes. To verify that the genes we selected require FoxH1 for their expression, we injected embryos with FoxH1 morpholino and analyzed the effect on transcription. Shown are the fold changes in relative expression levels of FoxH1 morpholino-injected embryos compared to control morpholino-injected embryos at high stage for FoxH1 targets dusp6, flh, wnt11 and gadd45bb. Reduction of FoxH1 results in decreased transcription for all FoxH1 target genes. (G) Expression of dusp6, flh, wnt11 and gadd45bb was analyzed by qPCR at 512-cell, early 1K, mid 1K and high stage in control and FoxH1 morpholino-injected embryos. All four target genes show a delay in the time when they are first transcribed in the FoxH1 morphants compared to control morpholino-injected embryos. Error bars represent SEM (n ≥ 4). (H) Staging by morphology was verified by cell counting at the stages used for the Pou5f3 morpholino analysis. Each data point represents a single embryo. Error bars represent SEM. Gene expression is normalized to the expression of eif4g2α.
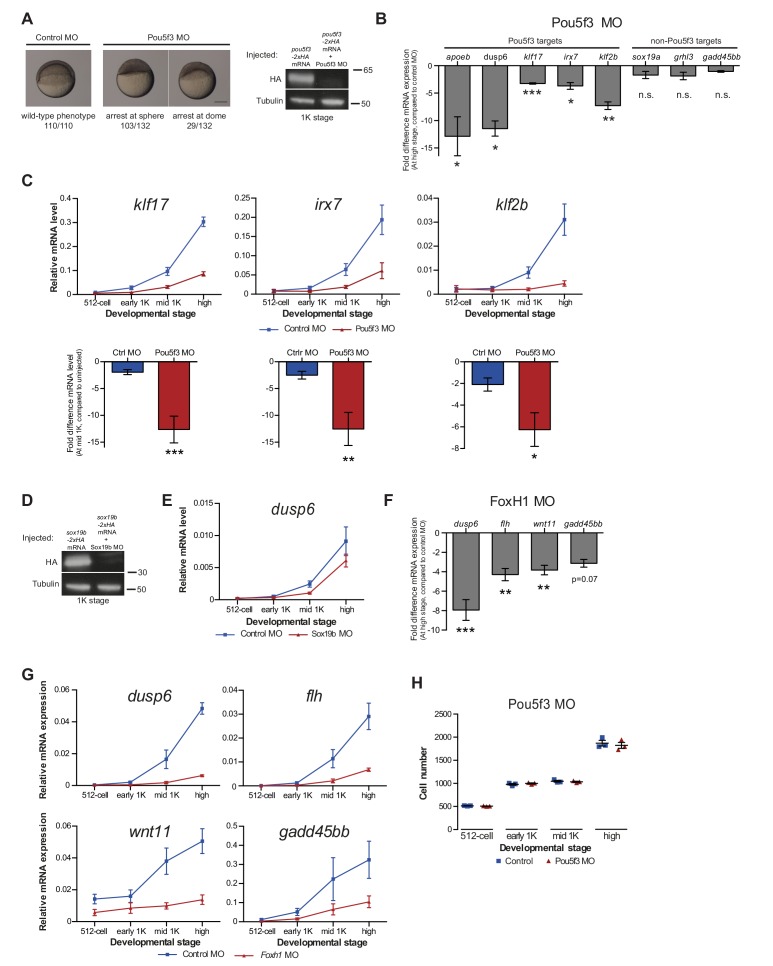
Figure 5—figure supplement 2. Increasing transcription factor levels causes premature transcription.

Figure 5—figure supplement 2.

(A) Pou5f3 overexpression validation. Brightfield images of embryos that were injected with control or pou5f3 mRNA. Developmental defects at 24 hpf resembled the ventralized phenotypes described upon pou5f3-VP16 overexpression (Belting et al., 2011). Scale bar, 250 μm. Western blot using an HA antibody shows the protein level of Pou5f3-2xHA and Sox19b-2xHA in embryos at 1K stage after injection at the 1 cell stage. Blot shown is a representative example (n = 2). (B) To test whether Pou5f3 and Sox19b are sufficient to drive expression of the genes we selected, we increased the level of both transcription factors and analyzed the effect on transcription. Shown are the expression levels of apoeb, dusp6, klf17, irx7, and klf2b at high stage for embryos injected with pou5f3 + sox19b mRNA relative to control mRNA-injected. Error bars represent SEM (n ≥ 4). Increasing the levels of Pou5f3 and Sox19b only increased the relative expression level of apoeb and dusp6, suggesting that Pou5f3 and Sox19b are not sufficient to drive expression of the other genes. Error bars represent SEM (n ≥ 4). n.s p>0.05; *p<0.05 (two-tailed Student’s t-test, compared to control mRNA). (C) Expression of klf17, irx7 and klf2b and was analyzed by qPCR at 512-cell, early 1K, and high stage in uninjected, control and pou5f3 + sox19b mRNA-injected embryos. Bar graphs focus on the early 1K stage. Error bars represent SEM (n ≥ 4). n.s p>0.05 (two-tailed Student’s t-test, compared to control mRNA). (D) Staging by morphology was verified by cell counting at the stages used for the analysis. Each data point represents a single embryo. Error bars represent SEM. In B and C, expression is normalized to the expression of eif4g2α.