. 2017 May 31;6:e22441. doi: 10.7554/eLife.22441

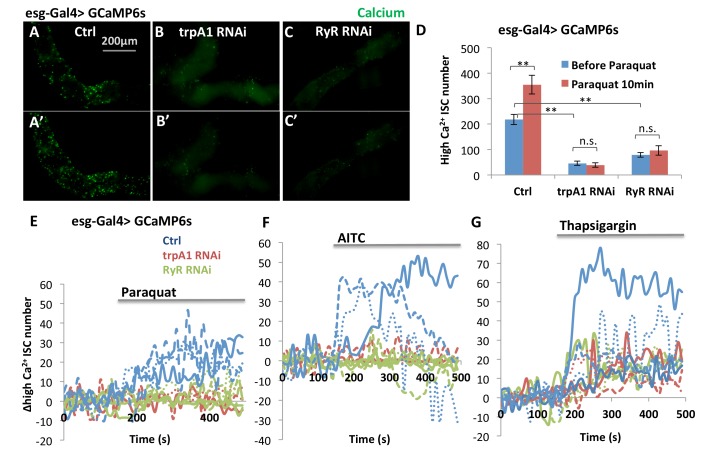
Figure 5. TRPA1 and RyR are required for ROS-mediated Ca2+ increases in ISCs.

(A–C) Imaging of midguts expressing the GCaMP6s reporter alone or together with trpA1 RNAi or RyR RNAi in ISCs. The same guts are imaged again after exposure to 4 mM paraquat in the imaging buffer for 10 min (A’–C’). The images are acquired on a Keyence microscope. (D) Quantification of high Ca2+ (GFP+) stem cells within the posterior midgut region. N > 5 midguts are analyzed for each genotype. Data are represented as mean ± SEM. (E–G) Numeric kinetics of high Ca2+ stem cells in midguts expressing trpA1 RNAi or RyR RNAi in ISCs. Wild-type midguts expressing GCaMP6s alone serve as control. Time-lapse confocal imaging is used for the analysis (see Supplementary Movies). The average number of high Ca2+ stem cells before drug treatment is set as the basal level of 0 for individual imaging experiments. Final concentration of 4 mM paraquat (E), 0.03% AITC (F), 4 µM thapsigargin (G) are added at 150 s. At least three replicates of each genotypes/treatments are shown in the figure, with different colors labeling different genotypes.

DOI: http://dx.doi.org/10.7554/eLife.22441.017

DOI: 10.7554/eLife.22441.018

Figure 5.

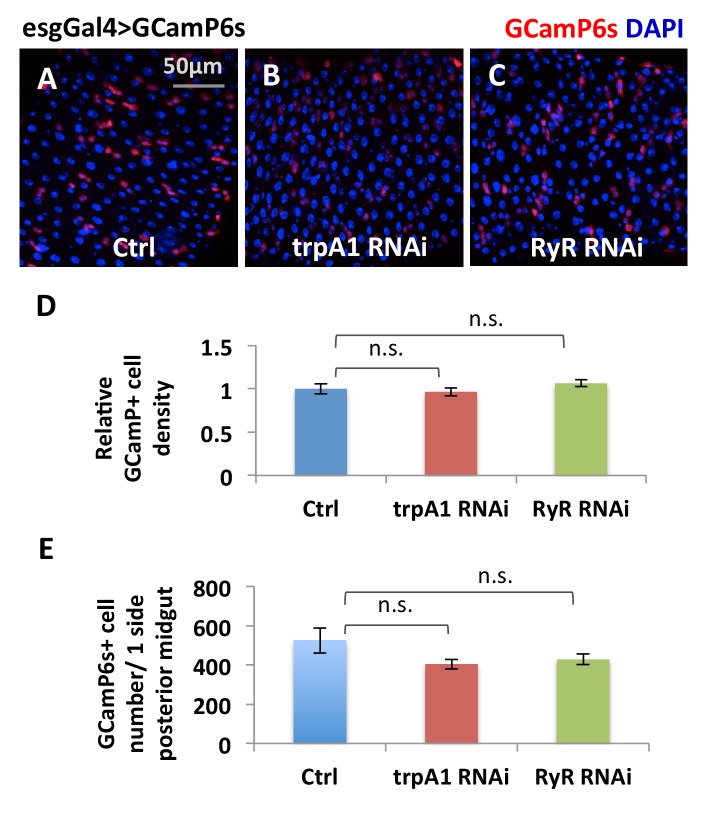
Figure 5—figure supplement 1. The total number of ISCs expressing esgGal4>GCamP6s reporter is not significantly reduced by trpA1 RNAi or RyR RNAi.

Figure 5—figure supplement 1.

(A–C) Anti-GFP staining of midguts expressing GCamP6s alone, or together with trpA1 RNAi or RyR RNAi in ISCs detects GCamP6s expression. The images are acquired on a confocal microscope. The relative density of GCamP6s+ (driven by esgGal4) cells, imaged on a Keyence microscope covering most of the posterior midgut region, is quantified in (D) while the total number of GCamP6s+ cells in the posterior midgut region is quantified in (E). N > 8 midguts are analyzed for each genotype. Data are represented as mean ± SEM.
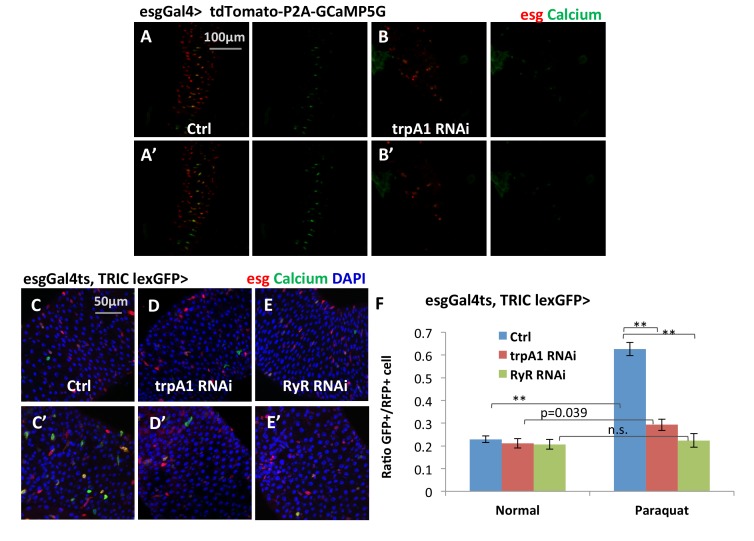
Figure 5—figure supplement 2. Additional reporters showing that TRPA1 and RyR are required for ROS-mediated Ca2+ increases in ISCs.

Figure 5—figure supplement 2.

(A–B) Confocal calcium imaging of midguts that express bi-cistronic UAS-tdTomato-P2A-GCaMP5G reporter alone or together with trpA1 RNAi in ISCs with exposure to 2 mM paraquat for 5 min (A’–B’). The bi-cistronic reporter consists of tdTomato that labels all cells expressing the reporter, and GCaMP5G whose GFP signal intensity reflects intracellular calcium concentration (Daniels et al., 2014). (C–E) Midguts expressing the TRIC lexGFP calcium reporter alone or together with trpA1 RNAi or RyR RNAi in ISCs for 6d, with the last 1d feeding 2 mM paraquat (C’–E’) are stained to examine stem cell Ca2+ concentration in vivo. The conventional UAS-RFP reporter is used to label all stem cells. (F) Quantification of high Ca2+ stem cells (GFP+) ratio to all stem cells (RFP+) for midguts in experiments (C–E). N = 16, 10, six images are analyzed for the genotypes of control, trpA1 RNAi, and RyR RNAi (half feeding normally, half feeding paraquat for 1d). Data are represented as mean ± SEM.