. 2017 May 31;6:e22441. doi: 10.7554/eLife.22441

Figure 7. Ras/MAPK activity, not CanA/CRTC/CrebB, is sufficient for ISC proliferation in the absence of TRPA1.

(A–E) Midguts over-expressing calcium responsive signaling molecules such as active Ras1 (Ras1A), constitutively active Calcineurin A1 (CanA1ca), CREB-regulated transcription coactivator (CRTC), or active form of Creb (Crebact) in ISCs for 5d are stained for the mitosis marker pH3. The expansion of esg>GFP signal by CanA1ca is reduced by trpA1 RNAi, although not quite down to the wild-type level. This could be due to the different kinetics of two reagents, as CanA1ca may take effect sooner than trpA1 RNAi. (A’–E’) Midguts expressing trpA1 RNAi together with calcium-responsive signaling molecules in ISCs for 5d are stained for the mitosis marker pH3. (F) Mitosis quantification of midguts expressing GFP, Ras/ Raf, RTK ligands Spi/ Pvf1, CanA1ca, CRTC, Crebact, alone or together with trpA1 RNAi for genetic epistasis analysis. N > 5 midguts are analyzed for each genotype. Data are represented as mean ± SEM. Although it has been reported that pvf1 overexpression can increase ISC population (Bond and Foley, 2012), we could barely detect mitotic effect of Pvf1 in young adult flies.

DOI: http://dx.doi.org/10.7554/eLife.22441.031

Figure 7—source data 1. Complete results for Figure 7F, Figure 7—figure supplement 1F–G.
DOI: 10.7554/eLife.22441.032

Figure 7.

Figure 7—figure supplement 1. Ras/MAPK activity, but not CanA1/CrebB, is required for ISC proliferation induced by calcium influx.

Figure 7—figure supplement 1.

(A–E) Midguts expressing SERCA RNAi together with Luc RNAi, EGFR RNAi, CanA1 RNAi, CrebB RNAi, or CRTC RNAi in ISCs for 3d are stained for mitosis marker pH3. (F) Mitosis quantification of midguts expressing SERCA RNAi together with Luc RNAi, EGFR RNAi (three different lines), Ras1 RNAi, Yki RNAi, CanA1 RNAi, CrebB RNAi (two different lines), or CRTC RNAi in ISCs for 5d. N > 7 midguts are analyzed for each genotype. Data are represented as mean ± SEM. (G) Mitosis quantification of midguts expressing SERCA RNAi2 alone, or together with CanA1 RNAifb5, or Yki RNAiv in ISCs for 5d. N > 5 midguts are analyzed for each genotype. Data are represented as mean ± SEM. For CanA1 RNAi line ‘fb5’, flies with a similar w- genetic background carrying an empty insertional landing site (v60100) are used as the control (Ctrlv). (H) RT-qPCR measurement of CRTC expression in midguts ubiquitously expressing Luc RNAi or CRTC RNAi for 5d. GAPDH and rp49 are used for normalization. The data are presented as mean ± SEM for three technical replicates. (I) RT-qPCR measurement of CanA1 RNAi fb5 knockdown efficiency. L3 larvae expressing RNAi for 2 days are used for better quantification because midgut CanA1 expression is barely detectable. GAPDH and rp49 are used for normalization. The data are presented as mean ± SEM for three technical replicates.
Figure 7—figure supplement 2. Ligands for receptor tyrosine kinases (RTKs) are affected by cytosolic Ca2+ signaling.

Figure 7—figure supplement 2.

(A) RT-qPCR measurement of midguts expressing Luc RNAi or trpA1 RNAi in ISCs for 6d, with the last day feeding on normal food or paraquat. rp49 is used for normalization. The data are presented as mean ± SEM for three technical replicates. While expression of JAK/ Stat pathway ligands upd1 and upd2 remains unaffected, multiple RTK ligands (spi, krn, vn, pvf1, pvf3, dilp3, highlighted by gray square boxes) are down-regulated by trpA1 RNAi. (B) RT-qPCR measurement of midguts expressing Luc RNAi or trpA1 RNAi in ISCs for 9d, with the last 2d feeding on normal food or paraquat. rp49 is used for normalization. The data are presented as mean ± SEM for three technical replicates. Note that only spi, pvf1, and dilp3 are consistently down-regulated in trpA1 RNAi groups in both (A) and (B). Different trends of krn, vn, and pvf3 expression observed in (B) compared to (A) might suggest a delay, rather than reduction of these ligands by trpA1 RNAi. (C) RT-qPCR measurement of midguts expressing Luc RNAi or SERCA RNAi in ISCs for 1d. Such early time point is chosen empirically to allow for efficient knockdown and avoid confounding effects of signaling pathway cross-activation at later stages of ISC proliferation. rp49 is used for normalization. The data are presented as mean ± SEM for three technical replicates.
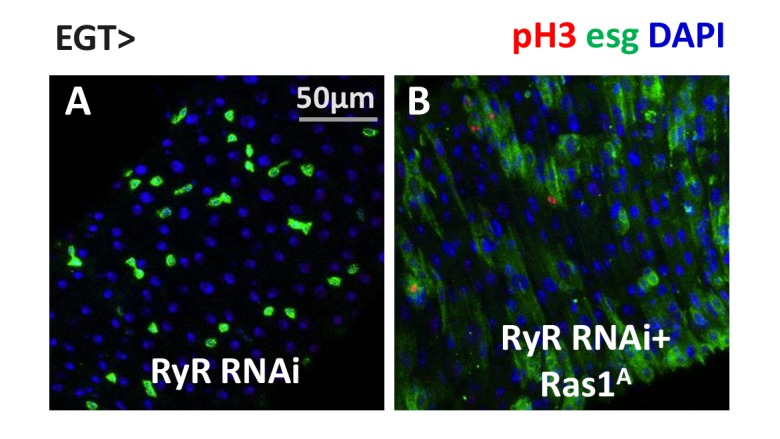
Figure 7—figure supplement 3. Ras/MAPK activity is sufficient for ISC proliferation in the absence of RyR.

Figure 7—figure supplement 3.

(A–B) Midguts, expressing RyR RNAi alone, or together with SERCA RNAi in ISCs for 5d, are stained for mitosis marker pH3.