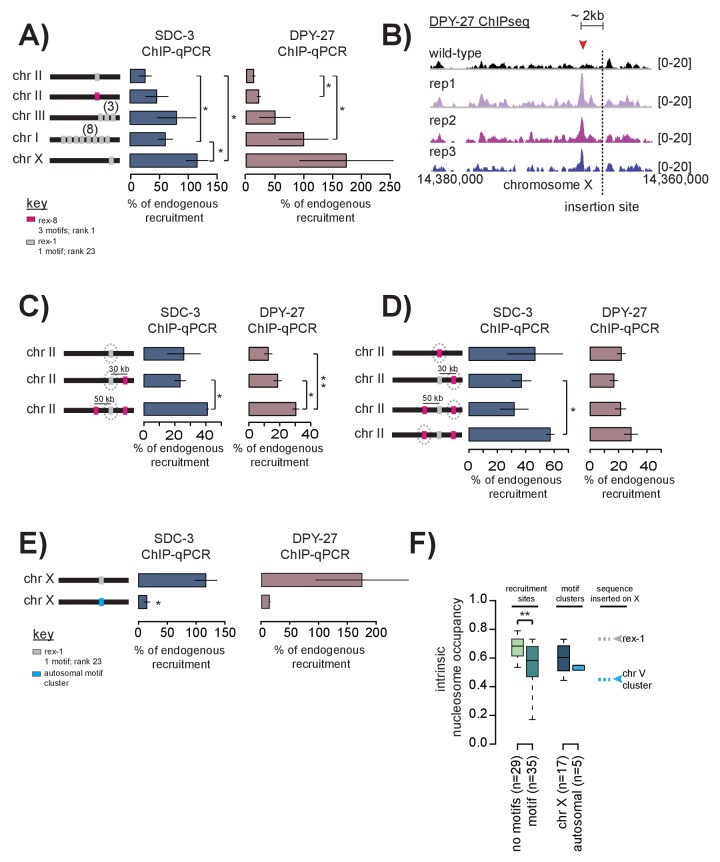
Figure 6. Cooperation between recruitment sites is necessary for robust DCC recruitment.
(A) SDC-3 (left, blue) and DPY-27 (right, brown) ChIP-qPCR data is plotted for the indicated ectopic insertions. ChIP-qPCR is plotted as percent of endogenous recruitment, that is, recruitment at the ectopic site is compared to recruitment at the corresponding endogenous sequence. MosSci was used to insert rex-1 and rex-8 sequence into the same locus on chromosome II. Bombardment was used to insert rex-1 sequence in three-copy on chromosome III and eight-copy on chromosome I. CRISPR was used to insert rex-1 sequence in single copy on chromosome X. Information on strain generation is available in Supplementary file 1A. Significance is tested using one-tailed t-test assuming unequal variance (*p-value<0.05; **p-value<0.01). (B) DPY-27 ChIP-seq data comparing wild-type average and three biological replicates of the ChIP-seq data in the strain bearing an ectopic insertion of rex-1 in single copy in chromosome X. The insertion site is indicated as the dashed line. Inserted rex-1 sequence is not shown, as ChIP-seq enrichment at the ectopic sequence is confounded by binding at the endogenous site. Location of the novel spreading peak in the insertion strain is indicated by the red arrowhead. (C) As in (A), SDC-3 and DPY-27 ChIP-qPCR data is plotted as percent of endogenous recruitment. Dashed circle indicates ectopic site being assayed in ChIP-qPCR. CRISPR was used to insert rex-8 sequence 30 kb downstream and 50 kb upstream of the ectopic rex-1 sequence on chromosome II. (D) As in (C), dashed circle indicates the ectopic site being assayed. (E) CRISPR was used to insert a motif cluster from chromosome V into the ectopic chromosome X site. Because the chromosome V site does not normally recruit the DCC, SDC-3 and DPY-27 ChIP-qPCR data is plotted as percent of endogenous rex-1 recruitment. (F) Boxplot indicates intrinsic nucleosome occupancy for a 150 bp window centered on either motif or recruitment site as indicated. Recruitment sites with no motifs (light green, median 0.684) have significantly higher DNA-encoded nucleosome occupancy compared to recruitment sites containing motifs (dark green, median 0.583). Motif clusters on the X (dark blue, median 0.604) have higher DNA-encoded nucleosome occupancy compared to motif clusters on the autosomes (light blue, median 0.548). Rex-1 has a nucleosome occupancy score of 0.732; the chromosome V motif cluster has a nucleosome occupancy score of 0.450).

