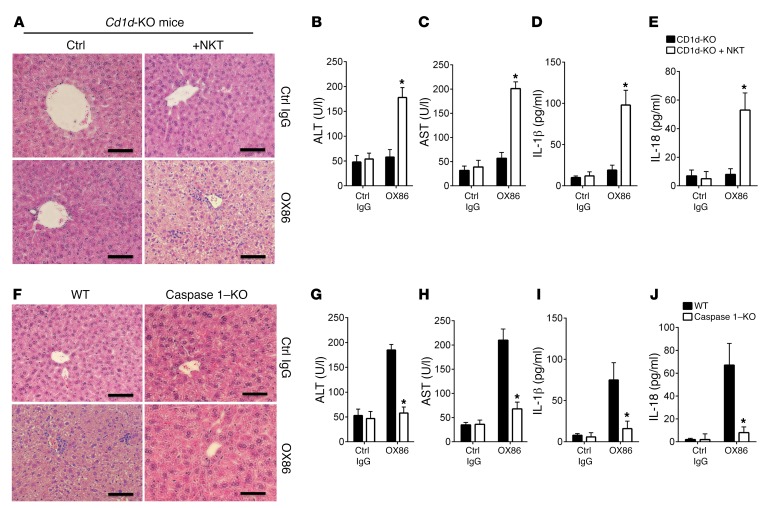
Figure 6. Pyroptotic death of iNKT cells induces liver injury.
(A) Liver histology of Cd1d-KO mice and Cd1d-KO mice receiving adoptive transfer of WT B6 iNKT cells and treated with OX86 or a control IgG (200 μg, i.p.). The liver pathology of these mice was examined by H&E staining. The tissue histology is representative of one of 6 experiments. Scale bars: 100 μm. (B and C) ELISA analysis of serum ALT and AST in Cd1d-KO mice and Cd1d-KO mice receiving transfer of WT iNKT cells and treated with OX86. Data shown are mean ± SD of 6 mice in each group. (D and E) ELISA analysis of serum IL-1β and IL-18 levels in OX86-treated Cd1d-KO and Cd1d-KO mice receiving transfer of WT B6 iNKT cells. Data shown are mean ± SD of 6 mice in each group. (F) H&E sections of liver tissues from WT B6 mice and caspase 1–KO mice treated with control IgG or OX86 mAb (200 μg, i.p.), showing liver injury, inflammatory cell infiltrates, and hepatocyte death. The tissue histology shown is representative of one of 6 experiments. Scale bars: 100 μm. (G and H) ELISA analysis of serum ALT and AST levels in control IgG– and OX86-treated WT B6 and caspase 1–KO mice. Data shown are mean ± SD of 6 mice in each group. (I and J) ELISA analysis of serum IL-1β and IL-18 levels in control IgG– and OX86-treated WT B6 and caspase 1–KO mice. Bar graphs represent mean ± SD of 6 mice in each group. P values were calculated by unpaired 2-tailed Student’s t test between Cd1d-KO and Cd1d-KO + NKT cells (B, C, D, and E) or between WT and caspase 1–KO mice (G, H, I, and J), *P < 0.05.

