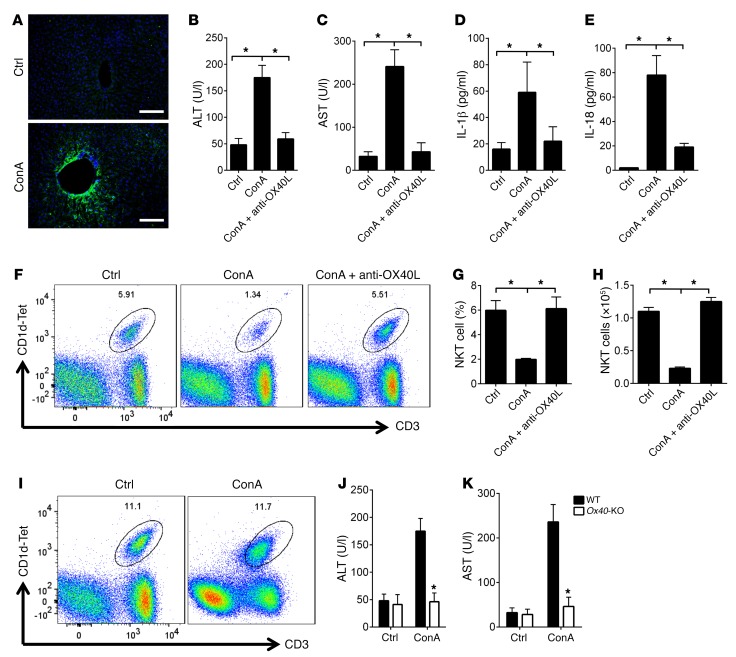
Figure 7. The OX40/NKT pathway is required in ConA-induced hepatitis.
(A) The WT B6 mice were injected with ConA at 1 mg/kg, i.p., or PBS as a control, and OX40L expression was examined by immunofluorescence staining 1 week later (from 9 fields of view per condition). Cell nuclei were stained with DAPI (blue) for identification and merged with OX40L (green). Scale bars: 100 μm. (B and C) ELISA analysis of serum ALT and AST in WT B6 mice injected with ConA, or with ConA and anti-OX40L antibody. The data shown are mean ± SD of 6 animals in each group. (D and E) ELISA analysis of serum IL-1β and IL-18 levels in WT B6 mice injected with ConA, or with ConA and anti-OX40L antibody. The data shown are mean ± SD of 6 animals in each group. (F) WT B6 mice were injected with ConA, and groups of mice were also treated with control IgG or anti-OX40L antibody; iNKT cells in the liver of treated mice were determined by FACS 1 week later. The FACS plot shows representative data of one of 6 animals. (G and H) The summary graphs represent relative percentage and absolute number of iNKT cells in WT B6 mice treated with PBS, ConA, or ConA and anti-OX40L mAb. Data shown are mean ± SD of 6 animals. (I) Ox40-KO mice were injected with ConA or PBS, and iNKT cells in the liver of treated mice were determined by FACS 1 week later. The FACS plot shows representative data of one of 6 animals in each group. (J and K) ELISA analysis of serum ALT and AST in Ox40-KO mice injected with ConA or PBS as a control. The data shown are mean ± SD of 6 animals in each group. P values were calculated by 1-way ANOVA (B, C, D, E, G, and H) and unpaired 2-tailed Student’s t test between control and ConA treatment (J and K), *P < 0.05.

