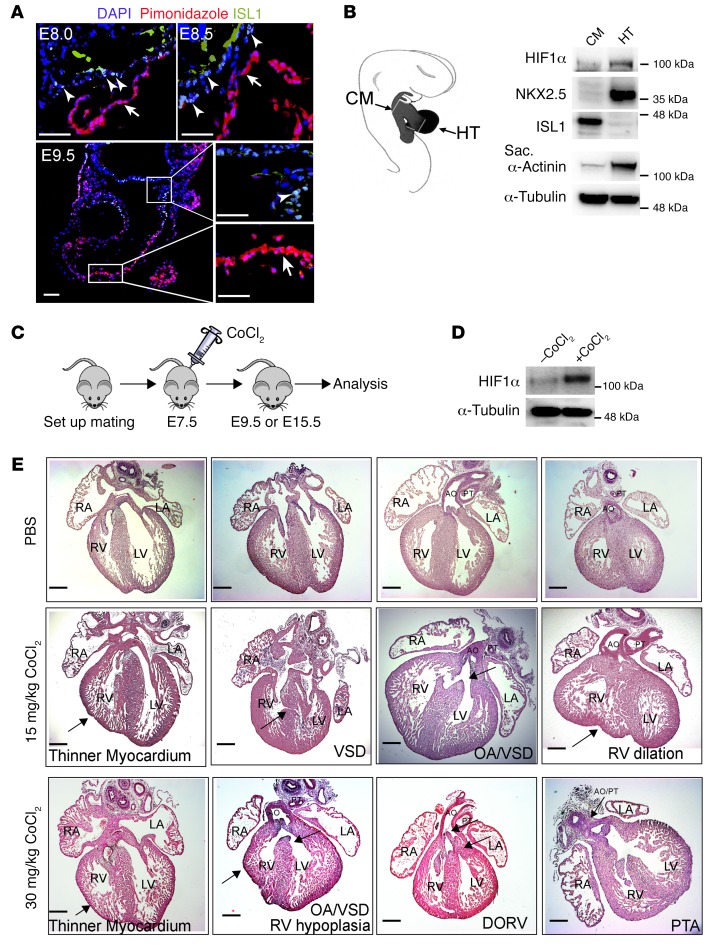
Figure 1. Experimental induction of hypoxia during early pregnancy leads to cardiac defects.
(A) Representative immunofluorescence images of cryosections from E8.0, E8.5, and E9.5 embryos stained for ISL1 and the hypoxia marker pimonidazole. For each time point, 2 embryos from 2 different litters were randomly selected for analysis (n = 4). ISL1+ cells in the cardiac mesoderm (indicated by arrowheads) are nonhypoxic (O2 ≤2%), whereas the myocardium (indicated by arrows) is hypoxic. Scale bars: 50 μm. (B) Western blot analysis of protein levels in the cardiac mesoderm containing adjacent outflow/inflow tract (CM) and the heart tube (HT) microdissected from E9–E9.5 embryos. A schematic depicting the isolation procedure is shown in the left panel. α-Tubulin was used as protein-loading control. Two separate experiments (3 individual litters per experiments) were analyzed, yielding similar results. Sarc, sarcomeric. (C) Schematic of the strategy for chemical induction of hypoxia responses at early embryonic stages. (D) Western blot analysis of HIF1α levels in cardiac mesoderm containing adjacent outflow tract isolated from E9.5 embryos with or without CoCl2 treatment. α-Tubulin was used as protein-loading control. Two separate experiments (3 individual litters per experiments) were analyzed, yielding similar results. (E) H&E staining of E15.5 hearts after experimental induction of hypoxia at E7.5. Fifteen embryos with PBS treatment from 3 litters (upper panels) and 22 embryos with 15 mg/kg (middle panels) or 30 mg/kg CoCl2 (lower panels) treatment from 4 different litters were analyzed. Arrows point to individual cardiac defects named in the figure. AO, aorta; PT, pulmonary trunk; LA, left atrium; RA, right atrium; DORV, double outlet right ventricle; PTA, persistent truncus arteriosus. Scale bars: 200 μm.

