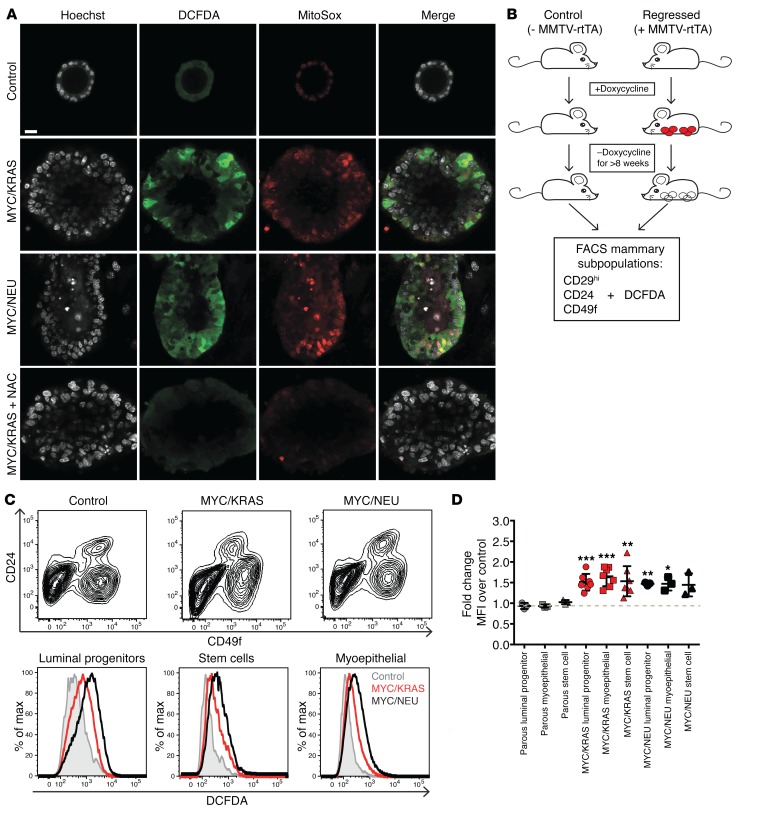
Figure 4. Elevated levels of oxidative stress following oncogene inactivation.
(A) Staining of organoid cultures with oxidative stress indicator DCFDA (green), superoxide specific MitoSox (red), and DAPI (gray). Single channel and merged representative images of never-induced (control), MYC/KRAS and MYC/NEU structures, and MYC/KRAS structures treated with N-acetylcysteine (NAC). Images are representative of triplicate experiments. Scale bar: 14 μm. (B) FACS was performed on regressed and control mice. To control for possible doxycycline effects, mice lacking the reverse tetracycline transactivator were used and placed in experimental cages along with the experimental mice and placed on a diet of chow containing doxycycline. When experimental mice developed a total tumor load of 2 cm3, all animals, experimental and control, were placed back on normal chow. Animals were maintained on doxycycline-free chow for > 8 weeks before being sacrificed for analysis. Red circles, mammary tumors; white circles, regressed tissue. (C) DCFDA was added to previously published FACS-based protocols for separation of mammary epithelial subpopulations. Upper panel: Representative FACS separation of subpopulations using previously published combination of CD29/CD24/CD49f for control, and MYC/KRAS and MYC/NEU regressed mice. Lower panel: Representative histograms the mean fluorescent intensities (MFI) of DCFDA in mammary epithelial cells isolated from age-matched control and regressed animals for the CD29hi/CD24hi/CD49fmed (luminal progenitors), CD29hi/CD24med/CD49fmed (myoepithelial), and CD29hi/CD24med/CD49fhi (Stem) populations. These results were representative for n = 9 (control), n = 3 (MYC/NEU), and n = 6 (MYC/KRAS) independent experiments. (D) Quantification of fold-change of MFI for DCFDA over age-matched control. Parous animals were included as a control for inflammation-driven oxidative stress. Luminal progenitors: MYC/KRAS vs. control, P = 0.0006; MYC/NEU vs. control, P = 0.002. Myoepithelial: MYC/KRAS vs. control, P = 0.0003; MYC/NEU vs. control, P = 0.03. Stem: MYC/KRAS vs. control, P = 0.0084 enriched populations. One sample t test. Data represented as mean ± SEM; *P < 0.05, **P < 0.01, ***P < 0.001.

