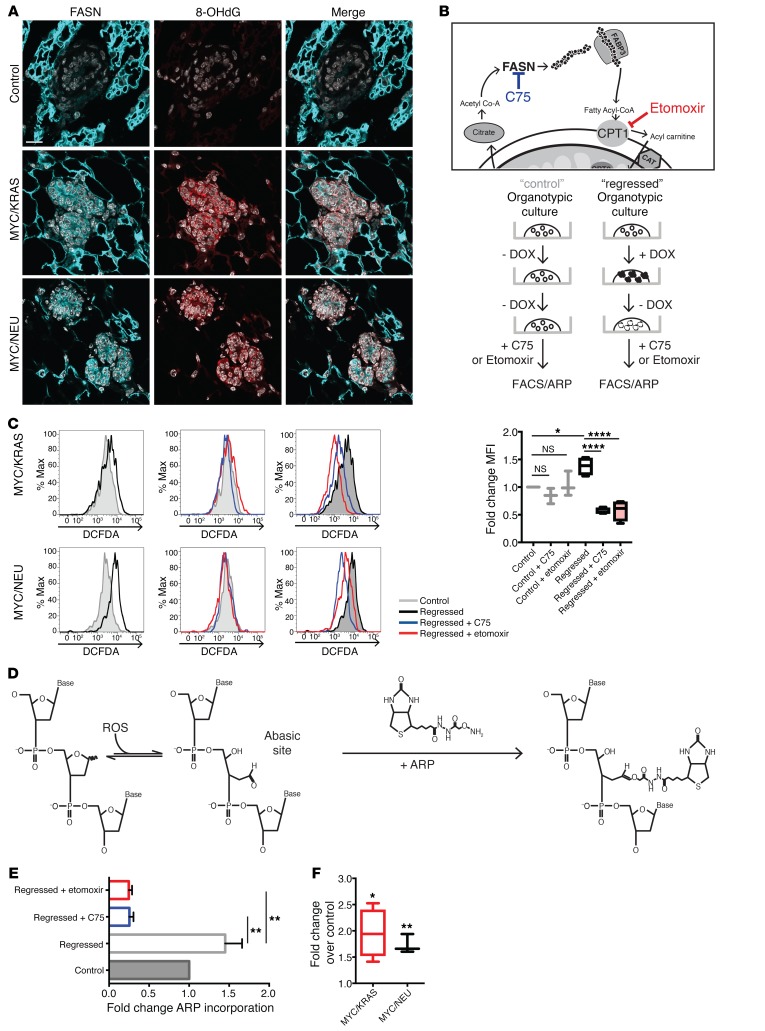
Figure 5. Inhibitors of lipid metabolism abrogate oxidative DNA damage in regressed cells.
(A) Confocal microscopy imaging of control and regressed mammary tissue stained for FASN (cyan), 8-hydrox-deGuaninine (8-OHdG; red), and DAPI (gray). Scale bar: 15 μm. (B) To causally link lipid metabolism to oxidative stress, organoid cultures were treated with C75 or etomoxir after oncogene withdrawal with 100 μm etomoxir or 0.6 μg/ml C75 for 24 hours. Following a 24-hour incubation, cells were assessed by DCFDA (FACS) and/or subjected to aldehyde reactive probe (ARP) assay (see below). (C) FACS of cells derived from treated organoid cultures. Upper panels: Representative histograms showing the difference in DCFDA control (gray) and regressed (black) organoids derived from MYC/KRAS and MYC/NEU mice. Middle panels: Representative histograms of control samples (gray) treated with C75 (blue) and etomoxir (red). Lower panels: Representative histograms of regressed samples (black) treated with C75 (blue) and etomoxir (red). Mean fold-change for (n = 3) control and (n = 4) regressed independent experiments is represented on the right. Regressed (P = 0.0189); regressed + C75 (P < 0.0001); regressed + etomoxir (P < 0.0001). One-way ANOVA with Sidak multiple comparison test. (D) ARP assay for base-excision repair intermediates. Detection of the apurinic/apyrimidinic sites is achieved through use of a biotinylated probe that binds the exposed aldehyde present in the AP site. Quantification is done using streptavidin-HRP. (E) Quantification of ARP assay represented as fold-change of ARP incorporated into the DNA isolated from C75- and etomoxir-treated and untreated regressed organoids (n = 2) and control (n = 2) untreated organoid cultures. Regressed + C75 (P = 0.0019); regressed + etomoxir (P = 0.0014). One-way ANOVA with Dunnetts multiple comparison test. (F) Quantification ARP assay represented as fold-change of ARP incorporated into the DNA isolated from experimental animals over age-matched controls. Represented for MYC/KRAS (P = 0.025), n = 4; MYC/NEU (P = 0.036), n = 3; control, n = 4 animals; one sample t test. Data represented as mean ± SEM; *P < 0.05, **P < 0.01, ****P < 0.0001.

