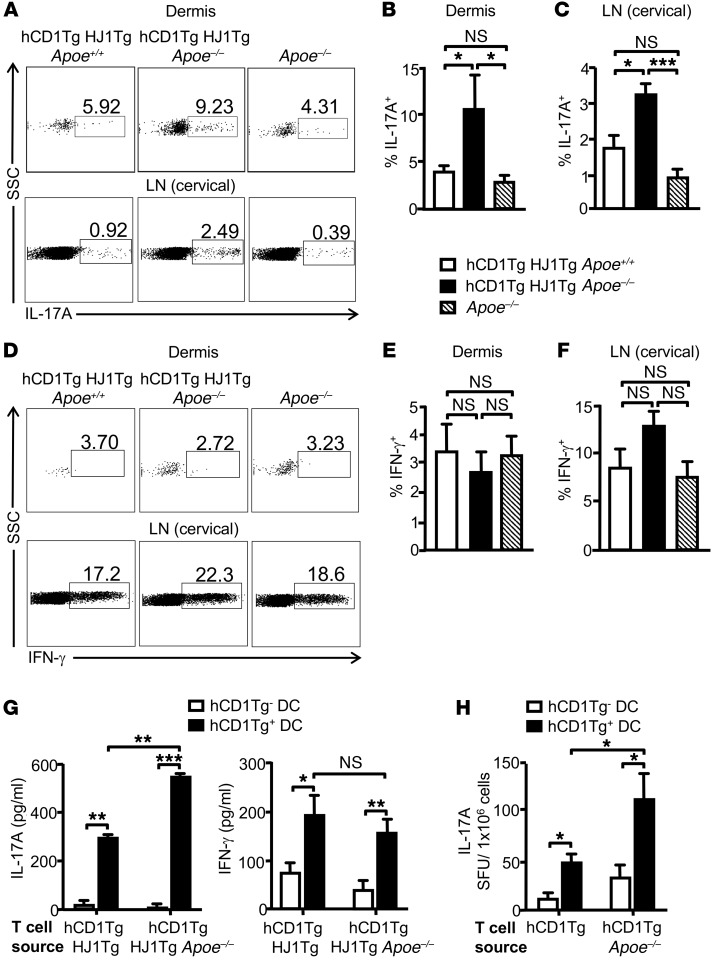
Figure 4. T cells in hCD1Tg HJ1Tg Apoe–/– mice produce elevated levels of IL-17A.
Dermal and LN cells from indicated mice were stimulated with PMA/ionomycin to measure intracellular cytokine secretion. Cells were gated on CD45+ and TCRβ+ populations. (A) Representative FACS plots of IL-17A–producing T cells in the dermis (upper panels) and cervical LNs (lower panels) in indicated mice. (B and C) Bar graphs (mean + SEM) depict the percentages of IL-17A–producing T cells in the dermis (B) and cervical LNs (C). (D) Representative FACS plots of IFN-γ–producing T cells in the dermis and cervical LNs. (E and F) Quantification of IFN-γ–producing T cells in the dermis (E) and cervical LNs (F) (n = 4–5). (G) WT (hCD1Tg–) and hCD1Tg+ BMDCs were cocultured with enriched T cells from either hCD1Tg HJ1Tg Apoe+/+ or hCD1Tg HJ1Tg Apoe–/– mice for 48 hours. Amount of IL-17A (left panel) and IFN-γ (right panel) was determined by ELISA. Data are representative of 3 independent experiments. (H) T cells were enriched from hCD1Tg and hCD1Tg Apoe–/– mice and cocultured with WT or hCD1Tg+ DCs for 24 hours. IL-17A–producing cells were quantified by ELISPOT assays. Data are representative of 2 independent experiments. ***P < 0.005; **P < 0.01; *P < 0.05. Statistical analyses were performed using 1-way ANOVA followed by Bonferroni’s post-hoc test for 3-group comparisons and Student’s t test for 2-group comparisons.

