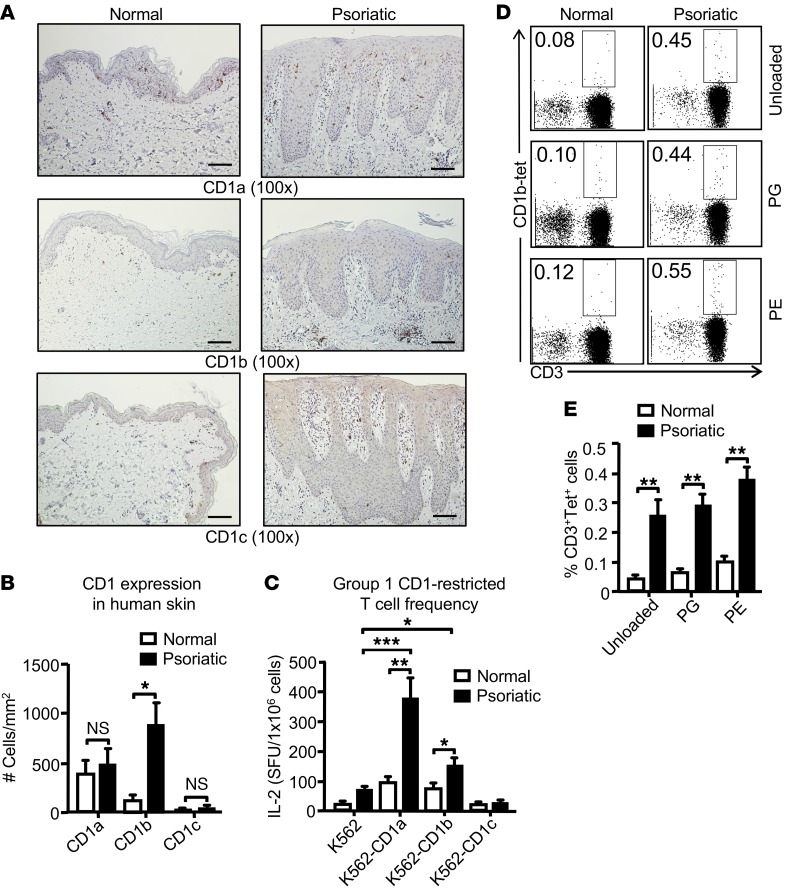
Figure 8. Psoriatic patients have an increased frequency of autoreactive group 1 CD1–restricted T cells.
Psoriatic and normal skin biopsies were stained with Abs against CD1a, CD1b, and CD1c. Scale bars: 100 μm. (B) Bar graph depicts number of CD1a-, CD1b-, and CD1c-positive cells/mm2 (mean + SEM) (n = 3); skin biopsies were derived from psoriatic patients who were hyperlipidemic. (C) K562 alone and K562 CD1 transfectants were cocultured with human T cells (n = 9) that were stimulated twice with autologous mo-DCs followed by IL-2 ELISPOT assay. (D) PBMCs from psoriatic and normal individuals were stained with untreated CD1b tetramers or CD1b tetramers loaded with PE and PG (n = 5 for psoriatic patients; n = 8 for normal individuals). Cells depicted on the FACS plots were first gated on the lymphocyte population and then on CD19– cells. (E) Bar graph depicts mean ± SEM of the percentages of tetramer-positive cells. ***P < 0.005; **P < 0.01; *P < 0.05, Mann-Whitney U test.

