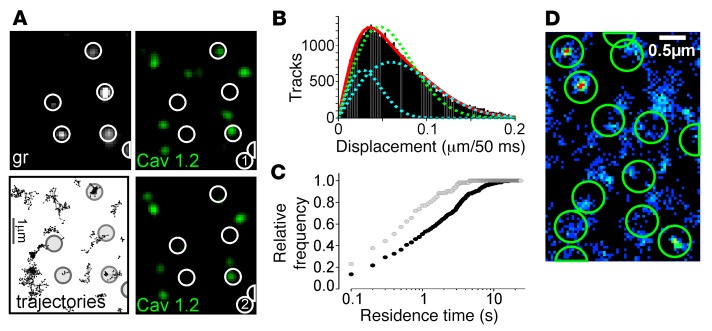
Figure 5. Single-molecule analysis of CaV1.2 behavior.
(A) Single-molecule imaging of EGFP-CaV1.2 at 50 Hz. Part of an INS1 cell expressing EGFP-CaV1.2 at low levels to facilitate observation of single molecules, at 2 different time points (1–2, bandpass filtered for clarity). Granules and trajectories of individual EGFP-CaV1.2 molecules with granule positions overlaid (large circles). Scale bar: 1 μm. (B) Histogram of single molecule distance traveled per frame (50 ms). The red line is a fitted diffusion equation with D1 = 0.007 and D2 = 0.035 μm2/s as diffusion coefficients; blue lines show the 2 components of the fit. The green line is the best fit, assuming a single diffusion coefficient. (C) Cumulative histograms of single-molecule residence times within circles of 100 nm diameter and centered at either granule (black) or random positions (gray). (D) Superresolution image obtained by plotting the area density of detected single molecules from a live cell. The granule positions are shown as circles. Scale bar: 0.5 μm.

