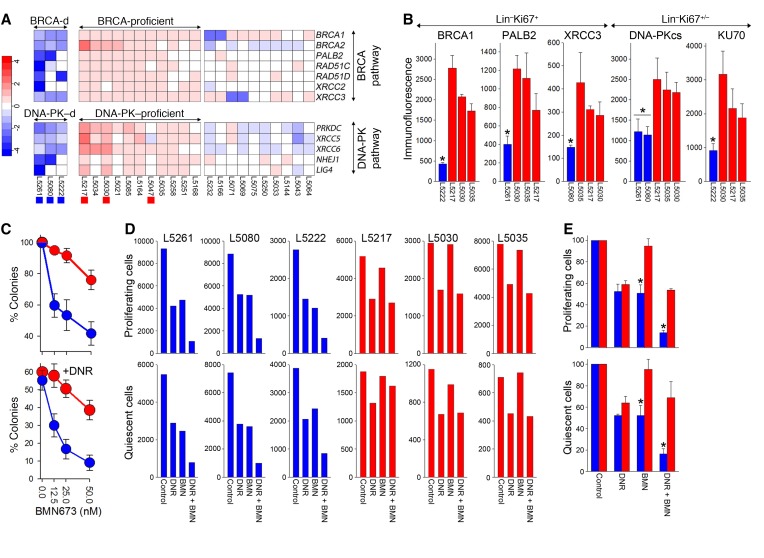
Figure 6. RT-qPCR identified BRCA/DNA-PK–deficient t-MDS/AMLs sensitive to dual synthetic lethality exerted by BMN673.
(A) BRCA/DNA-PK–deficient and –proficient t-MDS/AML samples; those used in further analyses are marked by colored squares at the bottom. Three samples (12%) displayed BRCA/DNA-PK deficiency (Z score < –1.5 of at least 1 gene in BRCA and DNA-PK pathways) and 11 were BRCA/DNA-PK proficient (Z score > –0.5 of all genes in BRCA and DNA-PK pathways). (B) Flow cytometric analysis of the indicated DSB repair proteins in BRCA/DNA-PK–deficient (blue) proliferating Lin–Ki67+ cells and proliferating/quiescent Lin–Ki67+/– cells, respectively, compared with BRCA/DNA-PK–proficient (red) samples. Each t-MDS/AML sample was measured 2–3 times. *P < 0.04 in comparison with all BRCA/DNA-PK–proficient samples. (C) Colonies from Lin–CD34+ BRCA/DNA-PK–deficient (blue, n = 3) and BRCA/DNA-PK–proficient (red, n = 3) samples treated with BMN673 (top graph) or DNR + BMN673 (bottom graph). (D) Number of proliferating Lin–CTVlo and quiescent Lin–CTVmax cells from individual BRCA/DNA-PK–deficient (blue) and –proficient (red) samples treated with DNR, BMN673, and DNR + BMN673. (E) Cumulative percentages from samples examined in panel D. *P < 0.003 in comparison with corresponding BRCA/DNA-PK–proficient samples using Student’s t test. *P = 0.08 or 0.11 in comparison with DNR- or BMN673-treated BRCA/DNA-PK–deficient samples, respectively, using 2-way ANOVA.

