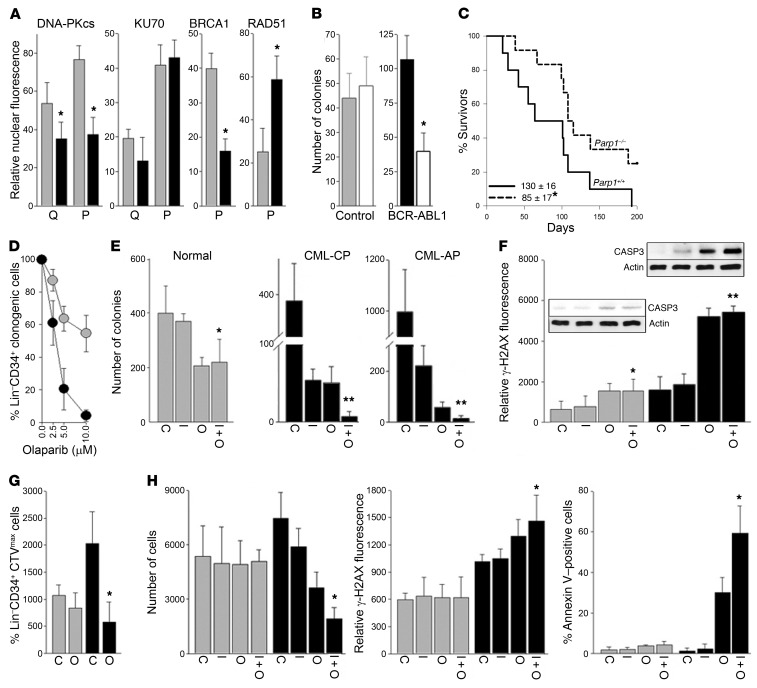
Figure 8. PARP1i inhibited BCR-ABL1–mediated transformation and eliminated BRCA1/DNA-PKcs–deficient quiescent and proliferating immature CML cells.
(A) Expression of indicated nuclear proteins in Lin–CD34+Ki67– quiescent (Q) and Lin–CD34+Ki67+ proliferating (P) cells from CML-CP patients (black bars, n = 3) and normal donors (gray bars, n = 3). *P < 0.05 using Student’s t test. (B) Number of colonies from BCR-ABL1–transformed or nontransformed (control) Parp1+/+ and Parp1–/– mBMCs (triplicate experiment). *P = 0.006 using Student’s t test. (C) Survival curves and MST of the tet-off SCLtTA p210BCR-ABL1 Parp1–/– (n = 12) and SCLtTA p210BCR-ABL1 Parp1+/+ (n = 10) mice. *P = 0.04 using Kaplan-Meier log-rank test. (D–H) Lin–CD34+ cells from CML-CP and CML-AP patients (black symbols; n = 3–10) and healthy donors (gray symbols; n = 3) were (D) treated with the indicated concentrations of olaparib or (E–H) left untreated (C) or treated with 1 μM imatinib (I), 5 μM olaparib (O), or a combination (I + O) for 5 days. (D and E) Lin–CD34+ clonogenic cells. *P < 0.05, **P < 0.001 in comparison with I using Student’s t test. **P ≤ 0.005 in comparison with I or O using 2-way ANOVA. (F) γ-H2AX immunofluorescence. *P < 0.05, **P < 0.001 in comparison with I. Active caspase 3 (CASP3) and β-actin detected by Western blot on parallel gels. (G) Lin–CD34+CTVmax quiescent cells/105 cells. *P < 0.05 in comparison with C using Student’s t test. (H) Lin–CD34+CD38–CTVmax quiescent cells. (Left) Number of cells/106 cells. *P < 0.05 in comparison with I. (Middle) γ-H2AX immunofluorescence. *P = 0.007 in comparison with I. (Right) Apoptotic cells. *P = 0.03 in comparison with I using Student’s t test.

