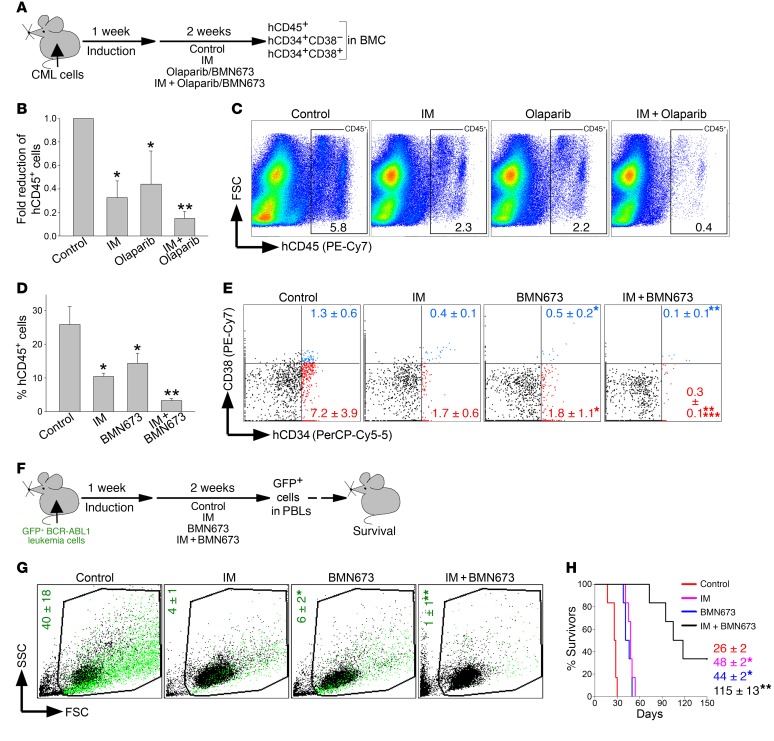
Figure 9. PARP1i exerted a therapeutic effect in mice bearing BCR-ABL1–positive leukemia.
(A) Experimental design: sublethally irradiated NSG mice were injected with Lin–CD34+ CML-CP cells (B and C) or Lin–CD34+ CML-AP cells (D and E) followed by treatment with vehicle (control), imatinib (IM), BMN673, olaparib, IM + BMN673, or IM + olaparib for 14 consecutive days. Leukemia burden was assessed by detection of indicated human cells in mBMCs. (B) hCD45+ CML-CP cells (n = 4–8/group). *P ≤ 0.003, **P < 0.02 in comparison with control and IM or olaparib, respectively, using Student’s t test adjusted for multiple comparisons. (C) Percentage of hCD45+ CML-CP cells (framed) in representative plots. (D) hCD45+ CML-AP cells (n = 4/group). *P < 0.01, **P ≤ 0.001 in comparison with control and IM or olaparib, respectively, using Student’s t test adjusted for multiple comparisons. (E) Percentage of Lin–hCD34+CD38– (red dots) and Lin–hCD34+CD38+ (blue dots) CML-AP cells; representative plots from 4 mice/group are shown. *P < 0.02, **P < 0.03 in comparison with control and IM, respectively, using Student’s t test. ***P = 0.08 in comparison with individually treated mice by 2-way ANOVA. (F) Experimental design: sublethally irradiated SCID mice were injected with GFP+BCR-ABL1 leukemia cells and 1 week later treated with vehicle (control), IM, BMN673, or IM + BMN673 for 14 consecutive days. GFP+ leukemia cells in peripheral blood leukocytes (PBLs) and survival were scored. (G) Percentages of GFP+BCR-ABL1 leukemia cells (green dots) in representative plots from 3–4 mice/group. *P = 0.01 in comparison with control using Student’s t test. **P < 0.02 in comparison with individually treated mice by 2-way ANOVA. (H) Survival curves and MST (n = 6 mice/group). * P < 0.001, **P < 0.001 in comparison with control and IM or BMN673, respectively, using Kaplan-Meier log-rank test.

