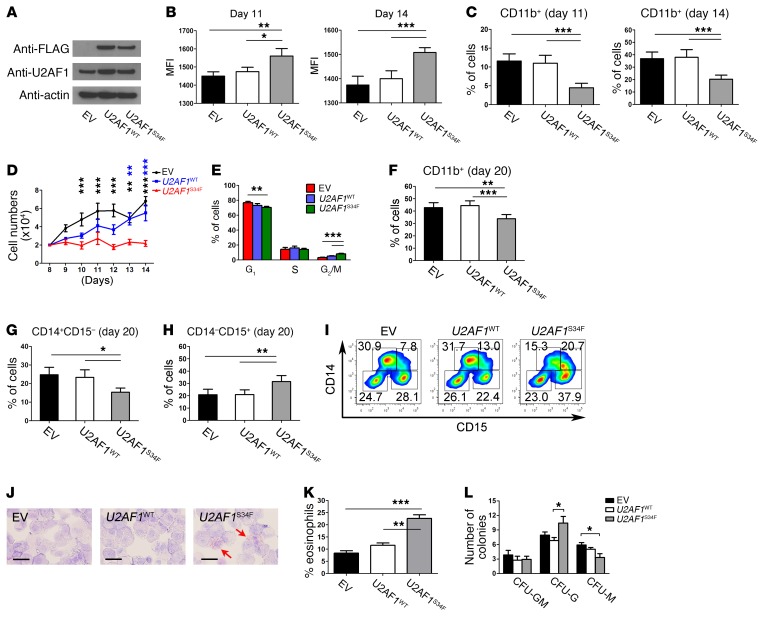
Figure 2. Expression of U2AF1S34F skews granulomonocytic differentiation toward granulocytes.
(A) Expression levels of U2AF1S34F and U2AF1WT protein in transduced granulomonocytic cells on day 11. Anti-U2AF1 and anti-FLAG antibodies were used to measure total U2AF1 protein and exogenous U2AF1S34F or U2AF1WT protein produced by the vector, respectively. (B) Median fluorescence intensity (MFI) of forward scatter (an indication of cell size) of granulomonocytic cells on days 11 and 14. (C) Percentage of CD11b+ cells in granulomonocytic cultures on days 11 and 14. (D) Cell counts for U2AF1S34F granulomonocytic cells from day 8 (the day when Geneticin selection was complete) to day 14 compared with EV and U2AF1WT controls. (E) Cell-cycle analysis of granulomonocytic cells on day 11. (F) Percentage of CD11b+ cells in granulomonocytic cultures on day 20. (G and H) Percentages of (G) CD14+CD15– monocytic cells and (H) CD14–CD15+ granulocytic cells in granulomonocytic cultures on day 20. (I) Representative flow cytometric plots on day 20 (n = 7). (J) Representative images of May-Grünwald-Giemsa–stained granulomonocytic cells on day 20 (n = 7). The red arrows indicate eosinophils. Scale bars: 25 μm. (K) Percentage of eosinophils per 100 cells on day 20. (L) Number of CFU granulocytes-macrophages (CFU-GM), CFU granulocytes (CFU-G), and CFU macrophages (CFU-M) obtained from hematopoietic CD34+ progenitors transduced with EV, U2AF1WT, or U2AF1S34F after 14 days in methylcellulose. Results shown in panels B–H, K, and L were obtained from 6, 8, 7, 6, 7, 7, 7, 6, and 7 independent experiments, respectively. Data represent the mean ± SEM. P values in panels B, C, E–H, K and L were calculated by repeated-measures 1-way ANOVA with Tukey’s post-hoc test. P values in panel D were calculated by 2-way ANOVA with Bonferroni’s post test. *P < 0.05, **P < 0.01, and ***P < 0.001.

