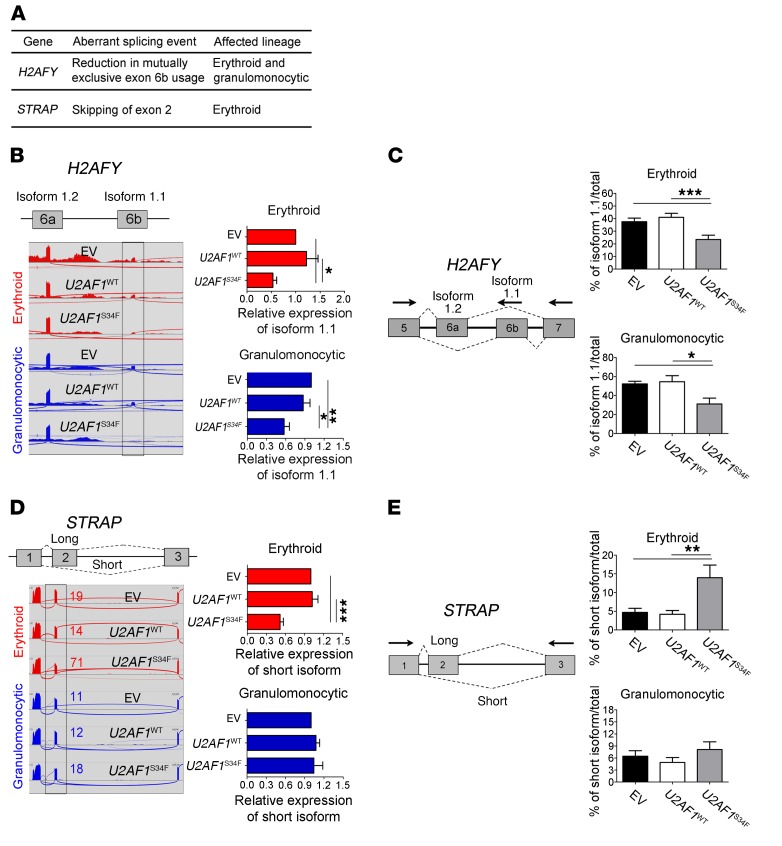
Figure 4. Confirmation of lineage-specific splicing alterations in U2AF1S34F erythroid and granulomonocytic cells.
(A) Genes of interest (H2AFY and STRAP) that exhibited differential aberrant splicing between U2AF1S34F erythroid and granulomonocytic colonies. (B and C) Mutually exclusive exons in H2AFY measured by (B) isoform-specific qRT-PCR and confirmed by (C) RT-PCR and gel electrophoresis. (D and E) Exon skipping in STRAP measured by (D) isoform-specific qRT-PCR and confirmed by (E) RT-PCR and gel electrophoresis. In panels B and D, sashimi plots illustrate RNA-seq results for H2AFY and STRAP in erythroid and granulomonocytic colonies. For each gene, the region affected by aberrant splicing is shown, and the aberrant splicing event is highlighted in gray. In panel D, the qRT-PCR was specific for the long STRAP isoform, as it was not possible to design a qRT-PCR specific for the short isoform (as there are no unique exons that are specific for the short isoform). The decrease in expression levels of the long STRAP isoform observed in U2AF1S34F erythroid cells is due to the aberrant splicing, which removes exon 2 from the long isoform, resulting in the generation of the short isoform and a concomitant depletion of the long isoform. Expression of the isoform associated with aberrant splicing by U2AF1S34F in transduced cells was measured by isoform-specific qRT-PCR relative to U2AF1WT and EV controls (red bars: erythroid cells; blue bars: granulomonocytic cells). In panels C and E, quantification of altered splicing events in gel was performed using ImageJ. Results for each bar graph were obtained from 5 independent experiments in panels B–E. Data represent the mean ± SEM. P values in panels B–E were calculated by repeated-measures 1-way ANOVA with Tukey’s post-hoc test. *P < 0.05 and **P < 0.01.

