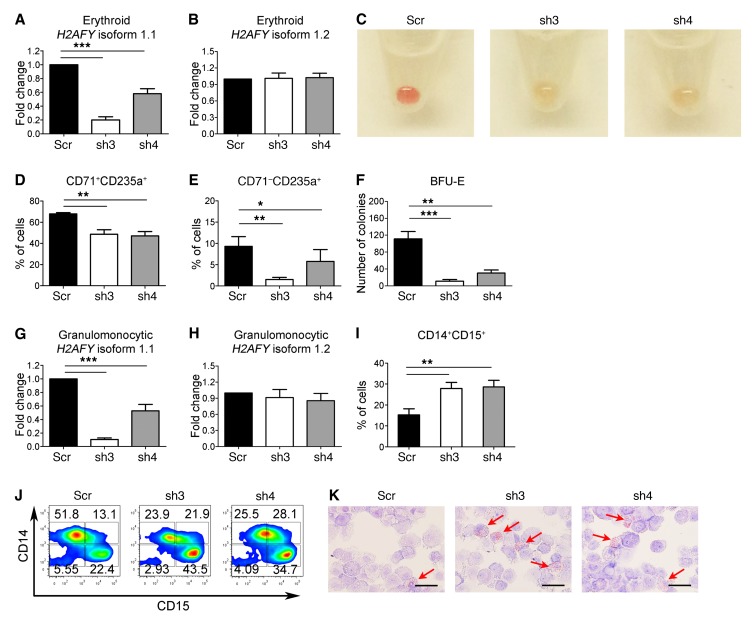
Figure 5. Knockdown of H2AFY isoform 1.1 perturbs erythroid and granulomonocytic differentiation.
(A and B) Expression levels of H2AFY (A) isoform 1.1 and (B) isoform 1.2 were determined using isoform-specific qRT-PCR in erythroid cells with H2AFY isoform 1.1 knockdown. (C) Images of erythroid cell pellets on day 14 of culture for visual determination of hemoglobinization (n = 6). (D and E) Erythroid differentiation measured by expression of CD71 and CD235a cell-surface markers using flow cytometry. (D) Intermediate erythroid (CD71+CD235a+) cell population on day 11 of culture and (E) late erythroid (CD71–CD235a+) cell population on day 14 of culture. (F) Number of BFU-E obtained from hematopoietic CD34+ progenitors with H2AFY isoform 1.1 knockdown after 14 days in methylcellulose (colony-forming cell assays). (G and H) Expression levels of H2AFY (G) isoform 1.1 and (H) isoform 1.2 determined using isoform-specific qRT-PCR in granulomonocytic cells with H2AFY isoform 1.1 knockdown. (I) Percentage of CD14+CD15+ cells in granulomonocytic cultures on day 20 of culture. (J) Representative flow cytometric contour plots showing expression of CD14 and CD15 on day 20 of culture (n = 8). (K) Representative images of May-Grünwald-Giemsa–stained granulomonocytic cells on day 20 of culture (n = 8). The red arrows indicate eosinophils. Scale bars: 25 μm. Results in each bar graph were obtained from 6 independent experiments for panels A, B, and D–H, and from 8 independent experiments for panel I. Data represent the mean ± SEM. P values in panels A, B, and D–I were calculated by repeated-measures 1-way ANOVA with Tukey’s post-hoc test. *P < 0.05, **P < 0.01, and ***P < 0.001. Scr, scramble; sh3, shRNA 3; sh4, shRNA 4.

