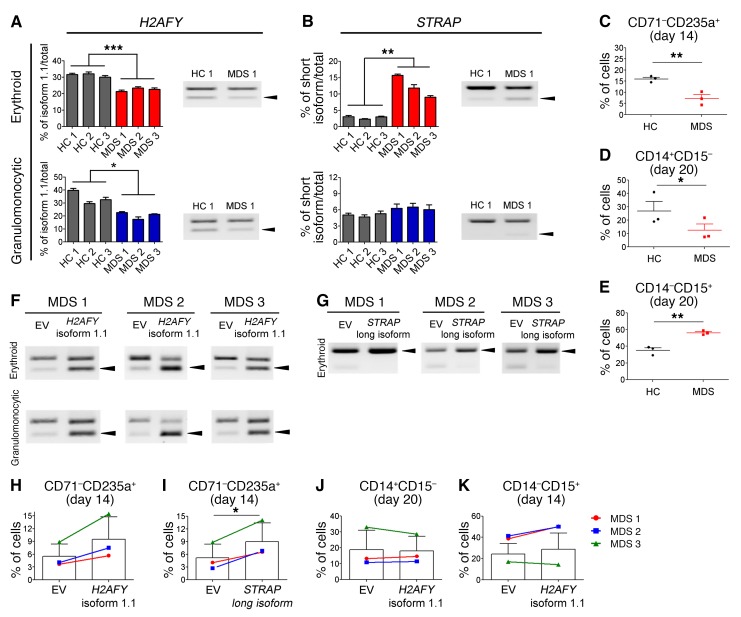
Figure 7. Effects of H2AFY isoform 1.1 and STRAP long isoform overexpression on erythroid and granulomonocytic differentiation in hematopoietic progenitors from U2AF1S34F MDS patients.
(A) H2AFY isoform 1.1 ratio in U2AF1S34F MDS–differentiated erythroblasts and granulomonocytic cells (day 7 in culture) compared with that in healthy controls (HC). Arrowheads in blot indicate H2AFY isoform 1.1. (B) STRAP short isoform ratio in U2AF1S34F MDS–differentiated erythroblasts (day 7 in culture) compared with healthy controls. Arrowheads in blot indicate the STRAP short isoform. (C–E) Impaired erythropoiesis and skewed differentiation toward granulocytes in U2AF1S34F MDS hematopoietic progenitors compared with healthy controls. (C) Late erythroid (CD71–CD235a+) cell population on day 14 of culture and (D) monocytic (CD14+CD15–) and (E) granulocytic (CD14–CD15+) cell populations on day 20 of culture were measured by flow cytometry. (F and G) Overexpression of (F) H2AFY isoform 1.1 and (G) STRAP long isoform in U2AF1S34F MDS hematopoietic progenitors differentiating toward erythroid and granulomonocytic lineages. Arrowheads in blots indicate H2AFY isoform 1.1 or the STRAP short isoform. (H–K) Effects of H2AFY isoform 1.1 and STRAP long isoform overexpression on erythroid and granulomonocytic differentiation of U2AF1S34F MDS hematopoietic progenitors. Late erythroid (CD71–CD235a+) cell population in transduced erythroblasts expressing H2AFY isoform 1.1 (H) or the STRAP long isoform (I), measured by flow cytometry on day 14 of culture compared with the EV control. (J) Monocytic (CD14+CD15–) and (K) granulocytic (CD14–CD15+) cell populations in transduced granulomonocytic cells expressing H2AFY isoform 1.1 were measured by flow cytometry on day 20 of culture compared with the EV control. In panels A and B, quantification of altered splicing events in gel was performed using ImageJ. Bar graph results in A and B were obtained from 4 technical replicates. Data represent the mean ± SEM. P values in panels A–E were calculated by an unpaired, 2-tailed t test. P values in panels H–K were calculated by a paired, 2-tailed t test. *P < 0.05, **P < 0.01, and ***P < 0.001.

