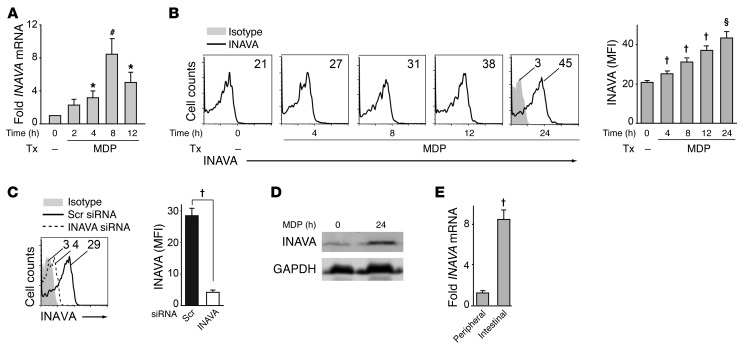
Figure 3. INAVA is expressed in peripheral and intestinal myeloid-derived cells, and INAVA expression increases with PRR stimulation.
(A) Human MDMs (n = 10) were stimulated for the indicated times with 100 μg/ml MDP. INAVA mRNA expression was normalized to untreated MDMs and GAPDH. Mean + SEM is shown. GAPDH expression was stable at each of these time points and similar INAVA mRNA regulation was observed with normalization to a different housekeeping gene, ACTB (data not shown). (B) MDMs (n = 8) were treated with 100 μg/ml MDP for the indicated times and INAVA protein levels were assessed by flow cytometry. Left: Representative flow cytometry plots with INAVA mean fluorescence intensity (MFI) values. Right: Summary of INAVA protein expression + SEM. Similar results were observed in an additional n = 8. (C) MDMs were transfected with scrambled or INAVA siRNA and assessed for INAVA protein expression. Representative flow cytometry plot with summary graph (n = 8) for MFI + SEM are shown. (D) MDMs were treated with 100 μg/ml MDP for 24 hours and assessed for INAVA protein expression by Western blot (representative for 1 of 7 individuals). GAPDH was used as a loading control; GAPDH levels were stable over the time course examined (data not shown). (E) INAVA mRNA expression was assessed in intestinal (n = 7) and peripheral (n = 7) myeloid-derived cells and normalized to CD11c. Mean + SEM. Tx, treatment; scr, scrambled. *P < 0.05; #P < 0.01; §P < 0.001; †P < 1 × 10⁻⁴; determined by 2-tailed Student’s t test.

