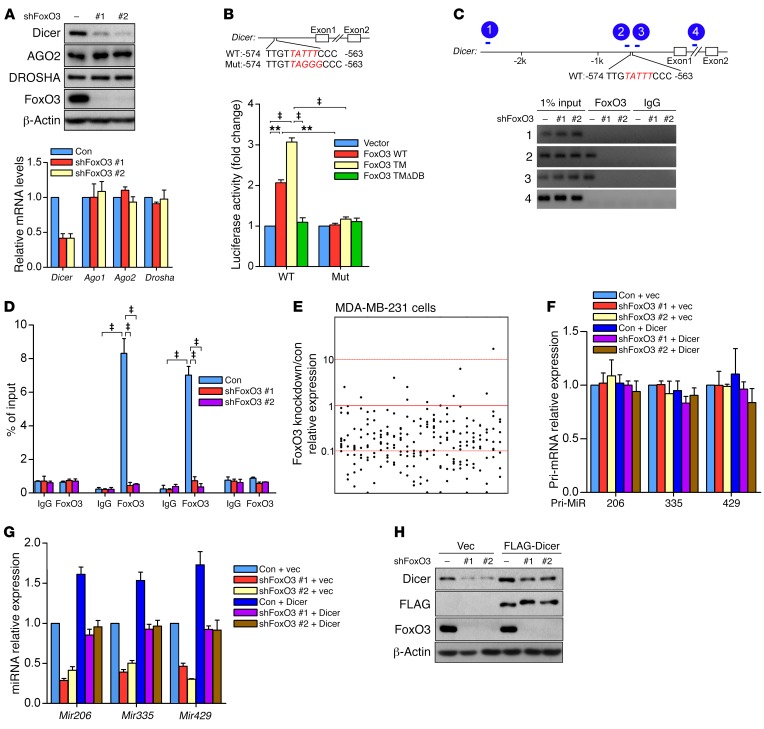
Figure 2. FoxO3 regulates Dicer expression and miRNA biosynthesis.
(A) LM2 cells were infected with lentivirus encoding FoxO3 shRNAs. Cell lysates and RNA were extracted and subjected to Western blotting (upper panel) or qRT-PCR (lower panel), respectively. Results are shown as mean ± SD. n = 3 independent experiments. (B) Luciferase assay of HEK-293T cells cotransfected with the Dicer promoter luciferase reporter and the indicated FoxO3 constructs. Upper panel: schematic of the Dicer promoter, showing the sequence of the putative FBEs in the human Dicer promoter region and the substitution mutations introduced into this FBE sequence. Lower panel: luciferase reporter activity results are depicted as bar graph with mean ± SD. n = 3 independent experiments. ‡P < 0.001; **P < 0.01, 2-way ANOVA with Bonferroni’s post hoc test. (C) ChIP assay in LM2 cells. Diagram of the Dicer promoter region with the amplicons used for PCR analysis (upper panel). ChIP analysis for the presence of FoxO3 at the Dicer promoter in LM2 cells with or without FoxO3 depletion (lower panel). (D) Data from C are depicted as bar graph with mean ± SD. n = 3 independent experiments. ‡P < 0.001, 2-way ANOVA with Bonferroni’s post hoc test. Con, control. (E) Dots show the ratio of miRNA expression levels in MDA–MB-231 cells depleted of FoxO3. (F and G) LM2 cells were infected with lentivirus encoding the indicated shRNAs. RNA was extracted and subjected to qRT-PCR. Results are shown as mean ± SD. n = 3 independent experiments. (H) LM2 cells stably expressing FLAG-Dicer and the indicated shRNAs were subjected to Western blotting.

