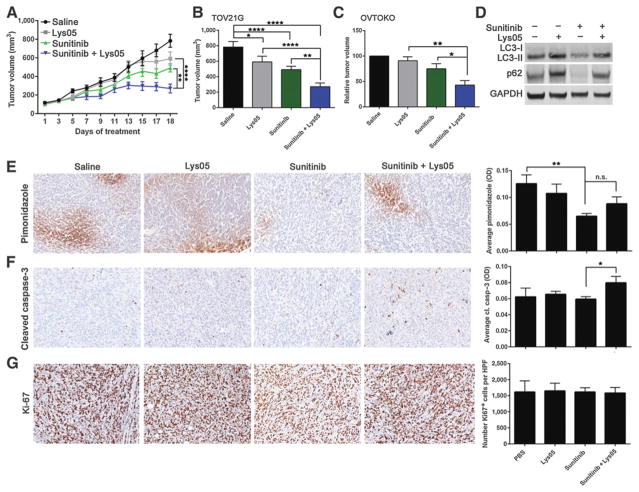
Figure 5.
Antitumor activity of sunitinib combined with Lys05 in TOV21G tumor xenografts. A and B, TOV21G cells (2 × 10⁶) were implanted subcutaneously into the right flank of NOD/Scid mice. When tumor volume reached approximately 100 mm3, mice were treated with saline, sunitinib (20 mg/kg), Lys05 (20 mg/kg), or the combination of the two agents for 18 days. Data are representative of 9 mice per treatment group ± SEM. Statistical significance was calculated using a two-way ANOVA with a Tukey multiple comparison posttest. C, Relative tumor volume of OVTOKO tumors 13 days post-saline, sunitinib (20 mg/kg), Lys05 (20 mg/kg), or combination treatment. Data are representative of 3 to 7 mice per treatment group ± SEM. Statistical analysis was calculated using a one-way ANOVA. D, TOV21G tumor lysates were pooled and analyzed for LC3-II and p62. GAPDH served as a loading control. E and F, Representative images of TOV21G tumor xenografts stained with pimonidazole (E) or cleaved caspase-3 (F). Graphs represent average pimonidazole or cleaved caspase-3 staining [optical density (OD)] from 3 to 5 high-power fields (HPF, 20×) representing 4 to 5 mice per treatment group ± SEM (one way ANOVA plus Sidak multiple comparison test, or Student t test). G, Representative images of TOV21G tumor xenografts stained with Ki-67. Graph represents average number of Ki-67+ cells per 3 to 5 HPFs per treatment group (n = 4–5 mice per group) ± SEM. *, P<0.05; **, P<0.01; ****, P<0.0001.

