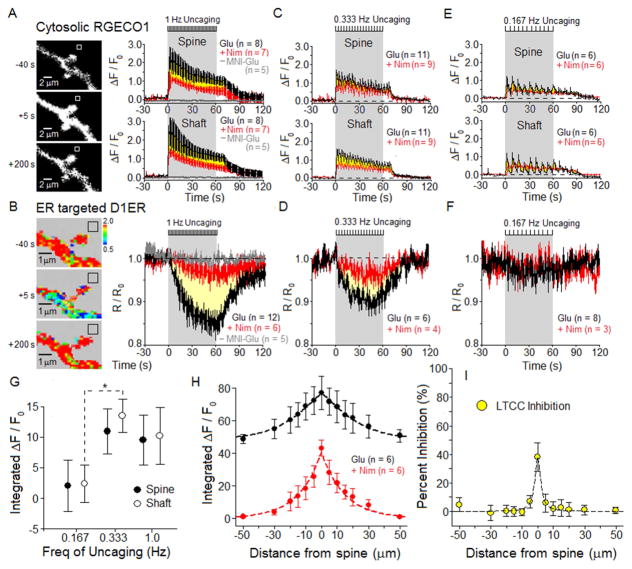
Figure 4. Frequency dependence of LTCC-driven Ca2+ signals.
For 12–14 DIV neurons expressing RGECO1 and D1ER, simultaneous imaging of [Ca2+]cyto and [Ca2+]ER was carried out for three different frequencies of glutamate uncaging: 1 Hz, 0.333 Hz and 0.167 Hz. Black hash marks at top of each time course indicate period of glutamate uncaging. Bath contained 1 μM glycine, 3 mM CaCl2 and 0 Mg2+; MNI-glutamate = 2 mM. Measurement of the time course of change in [Ca2+] was carried out in the dendritic spine or adjoining shaft. Throughout, mean ± SEM.
(A) Left, black and white images of RGECO1 in a dendritic shaft with spines, collected before, during and after 1 Hz uncaging. Right, in spines or adjoining shafts, average time course of RGECO1 responses (ΔF/F0) to uncaging in the absence (black) or presence of 5 μM nimodipine (red). Yellow area between the red and black time courses represents the nimodipine-sensitive component of the [Ca2+]cyto response to uncaging. No response detected in the absence of MNI-glutamate (gray).
(B) Left, pseudo color-coded FRET image of the same neuron as in A, for D1ER imaging of [Ca2+]ER. Right, average time course of [Ca2+]ER depletion from the dendritic spine and adjoining shaft, normalized to initial D1ER signal (R/R0), in the absence (black) or presence of nimodipine (red). Yellow area between the black and red time courses represents the nimodipine-sensitive component of Ca2+ release from the ER. No ER depletion detected in the absence of MNI-glutamate (gray).
(C–F) Reducing uncaging frequency reduced the size of LTCC-dependent components of [Ca2+]cyto and [Ca2+]ER responses. Figure S5 presents images of dendritic spines studied using 0.333 Hz and 0.167 Hz uncaging. See also Figure S6.
(G) Frequency dependence of the LTCC-dependent component of [Ca2+]cyto and [Ca2+]ER responses. To preserve fixed total stimulation, varying only frequency of stimulation, the R/R0 signals were integrated over the first 10 uncaging flashes, with the flashes presented at 0.167, 0.333 or 1 Hz (integration periods of 60, 30 or 10s).
(H) For single spines (at 0 μm) stimulated by 1 Hz uncaging for 60 s: extent along the adjacent dendritic shaft of total (black) and nimodipine-insensitive (red) time-integrated RGECO1 Ca2+ signals (reflecting [Ca2+]cyto)
(I) Subtraction of nimodipine-insensitive signal (red) from total (black) in H, converted to percent inhibition of the nimodipine-sensitive component (reflecting region of LTCC inhibition), is plotted as a function of distance along the dendritic shaft from the stimulated spine.

