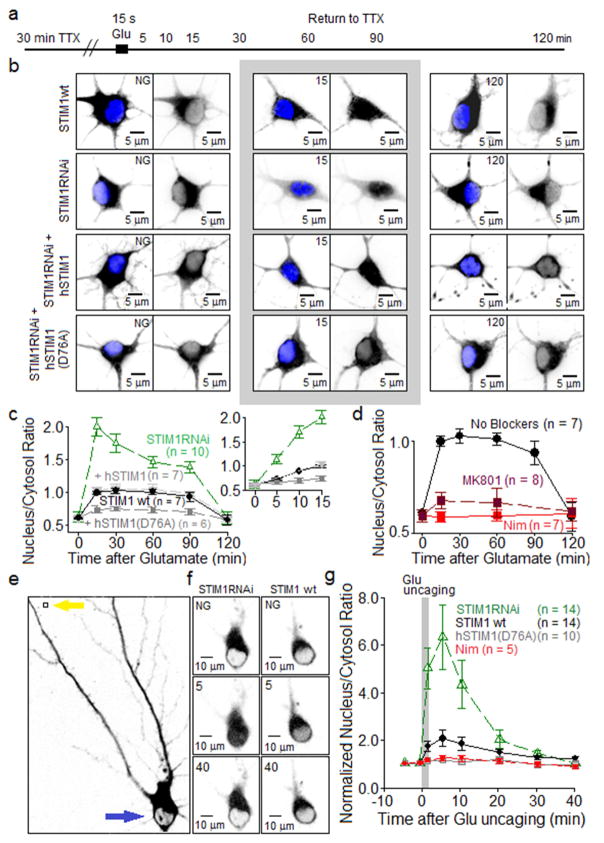
Figure 7. Attenuation of nuclear translocation of NFATc3 following STIM1 inhibition of L channels.
(A) Following 30 min pre-incubation in TTX to silence spontaneous synaptic activity in the cultures, neurons (4–5 DIV) were stimulated by 15 s application of 100 μM glutamate + 1 μM glycine. Neurons were returned to TTX-containing solution until fixed at times indicated in the schematic.
(B) Two-dimensional, summed-intensity projection images of neurons expressing GFP-NFATc3 and stained with anti-GFP (black) and, to visualize the nucleus, DAPI (blue). Top row of images illustrates glutamate-triggered GFP-NFATc3 translocation in neurons with endogenous STIM1. Second row: STIM1RNAi neurons transfected with a short hairpin construct to suppress endogenous (rat) STIM1 expression. Third row: neurons co-expressed anti-rat STIM1RNAi and human STIM1 (hSTIM1); fourth row: neurons co-expressed anti-rat STIM1RNAi and constitutively active human STIM1 (D76A).
(C) Average time courses (± SEM) of GFP-NFATc3 nuclear translocation following application of glutamate. GFP-NFATc3 distribution was measured as the ratio between nuclear and cytoplasmic fluorescence intensity. Inset: same data, expanded time scale.
(D) Effects of MK801 and nimodipine on translocation of GFP-NFATc3 induced by 15 s bath application of glutamate.
(E) Left, black and white image of an RGECO1a-expressing neuron before glutamate uncaging. NFAT signal indicated in black. Yellow arrow indicates site of uncaging and blue arrow indicates region where NFAT translocation was measured (neuronal soma).
(F) Black and white images of somatic sGFP2-NFATc3 fluorescence intensity at three time points: before uncaging (NG = no glutamate) and at 5 min and 40 min after uncaging. Black marks NFAT signal. Left column, STIM1RNAi neurons. Right column, STIM1 wt neurons transfected with empty pSilencer vector.
(G) Average time courses (± SEM) of sGFP2-NFATc3 nuclear translocation following glutamate uncaging. sGFP2-NFATc3 distribution measured as the ratio between nuclear and cytoplasmic fluorescence intensity, normalized to pre-uncaging values.

