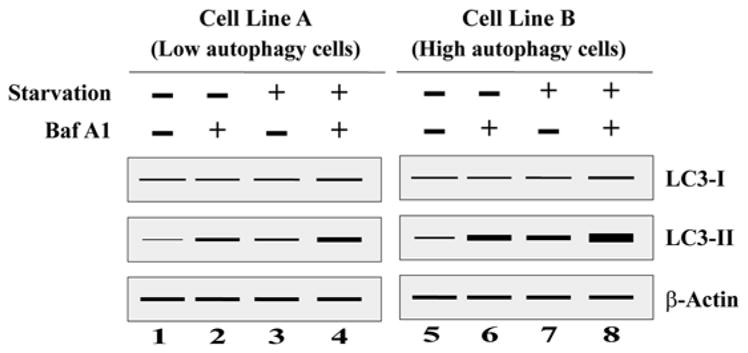
Fig. 9.3.

A schematic representation of a Western blot after LC3 turnover assay to distinguish autophagy level in low and high autophagic cells. Cells were cultured in regular nutrition-rich media without Baf A1 (lane 1 and 5), regular nutrition-rich media with Baf A1 (lane 2 and 6), starvation media without Baf A1 (lane 3 and 7), and starvation media with Baf A1 (lane 4 and 8). Baf A1 bafilomycin A1
