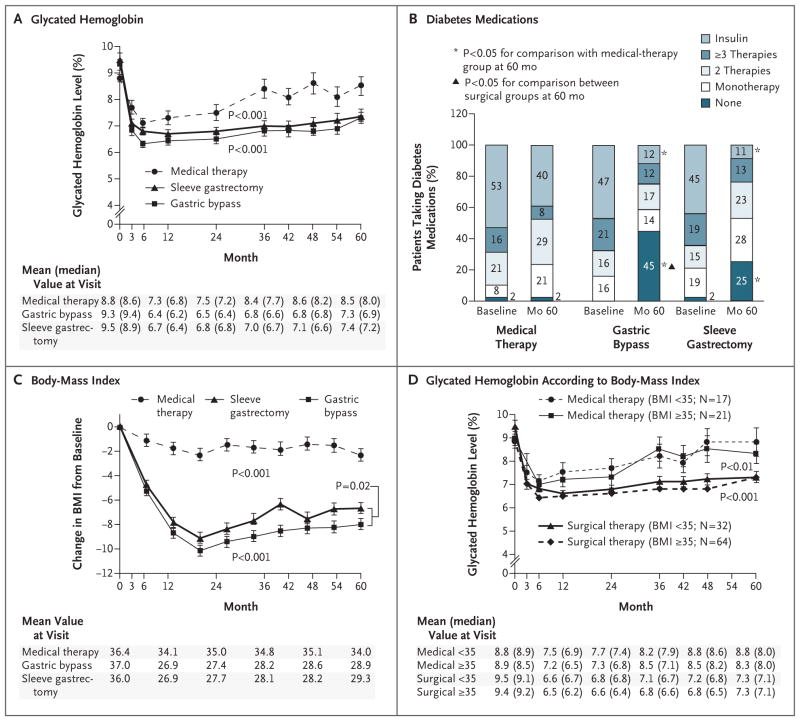
Figure 1. Mean Changes in Measures of Diabetes Control from Baseline to 5 Years.
Shown are the mean glycated hemoglobin levels (Panel A), the percent change in diabetes medications during the study period (Panel B), the changes in body-mass index (BMI, the weight in kilograms divided by the square of the height in meters) (Panel C), and the mean glycated hemoglobin levels according to BMI (Panel D) over a 5-year period among patients receiving intensive medical therapy alone, those who underwent sleeve gastrectomy, and those who underwent a gastric bypass procedure. ⌶ bars indicate standard errors. Mean values in each group are provided below the graphs; in Panels A and D, median values are also provided in parentheses. P values for the comparison between each surgical group and the medical-therapy group in Panels A, C, and D were derived from overall treatment effect in the repeated measurements model. In Panel D, P<0.001 for the comparison between the surgical groups and the medical-therapy group for the subgroup of patients with a BMI of less than 35; P<0.01 for the comparison for the subgroup with a BMI of 35 or more.

