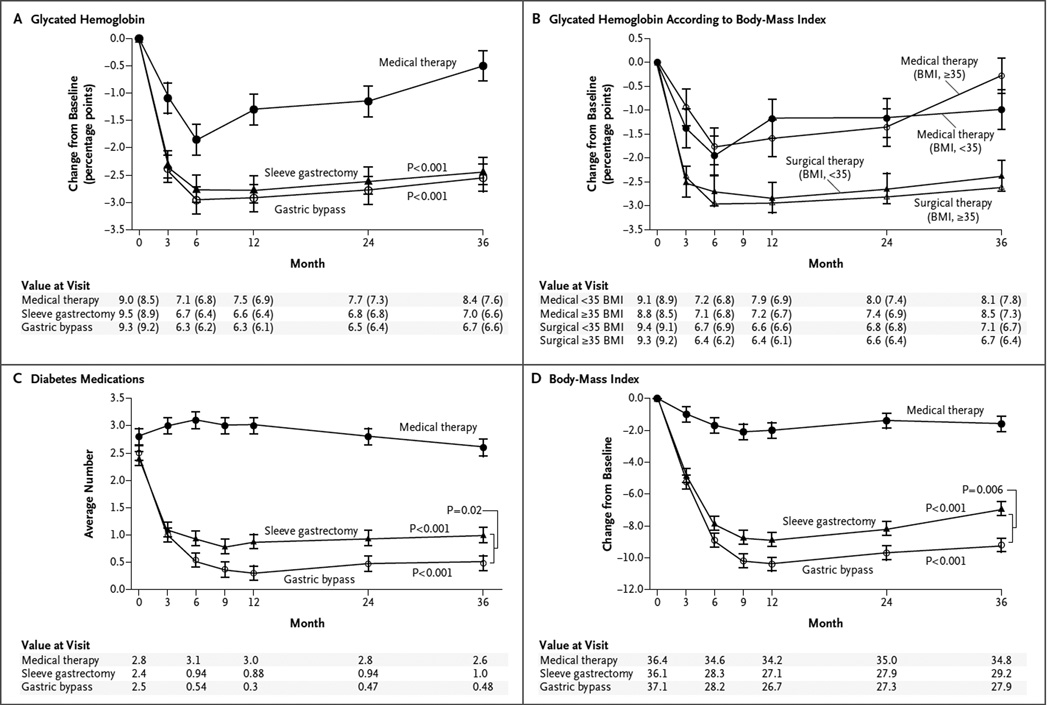
Figure 1. Mean Changes in Measures of Diabetes Control from Baseline to 3 Years.
Shown are the percentage change in glycated hemoglobin levels (Panel A), the percentage change in glycated hemoglobin levels according to body-mass index (BMI) (Panel B), the average number of diabetes medications during the study period (Panel C), and the changes in BMI (Panel D) over a 3-year period among patients receiving intensive medical therapy only, sleeve gastrectomy, or gastric bypass. I bars indicate standard errors. Mean values in each group are provided below the graphs; in Panels A and B, median values are also provided in parentheses. P values are for the comparison between each surgical group and the medical-therapy group in Panels A, C, and D. In Panel B, P = 0.008 for the comparison between the surgical groups and the medical-therapy group for the subgroup of patients with a BMI of less than 35; P<0.001 for the comparison for the subgroup with a BMI of 35 or more.

