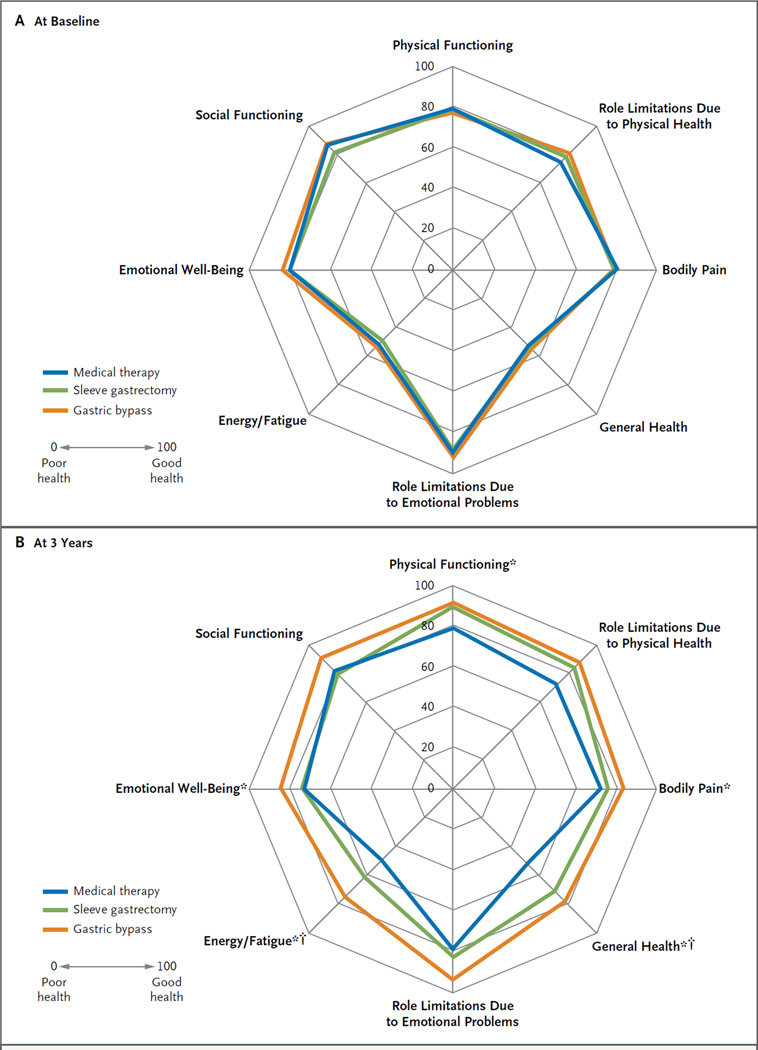
Figure 2. Polar Chart of Scores for Quality of Life at Baseline and 3 Years after Randomization.
The scores on the RAND 36-Item Health Survey range from the worst score of 0 (poor health) to the best score of 100 (good health). Asterisks indicate P<0.05 for the comparison between the gastric-bypass group and the medical-therapy group; daggers indicate P<0.05 for the comparison between the sleeve-gastrectomy group and the medical-therapy group. The minimally important difference (MID) in scoring for this survey is unknown.

