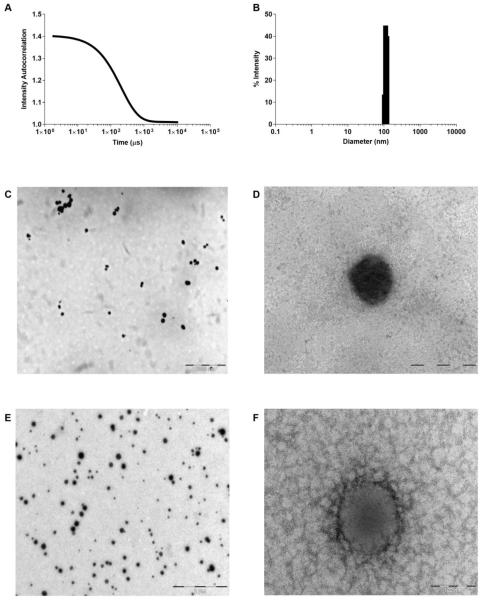
Figure 2.
Drug-loaded, iron stabilized micelles average 100 nm in diameter. (A) DLS Correlation Function Graph representing IT-141 micelle, and (B) histogram showing diameter range of IT-141 micelle. (C, D) Low and high-mag TEM image of IT-141 micelle stained with 1% osmium tetroxide. (E,F) Low and high-mag TEM image of IT-147 micelle stained with 1% uranyl acetate.

