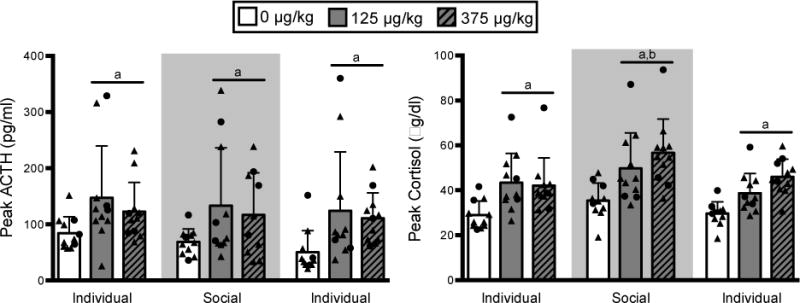
Fig 2. Naloxone challenge.

Peak (mean ± SD) ACTH (left) and cortisol (right) following saline (0 μg/kg) and naloxone (125 and 375 μg/kg) challenges. Both doses of naloxone increased ACTH and cortisol compared to saline (a: p < 0.05). The peak cortisol response to naloxone was greatest during the social housing phase (b: p < 0.05) when compared to both individual housed phases. Circles: dominant animals, triangles: non-dominant animals.
