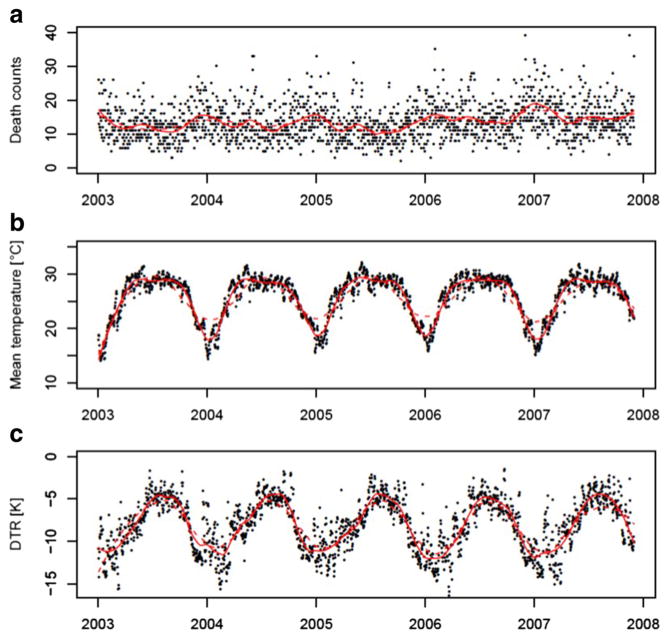
Fig. 1.
Time-series plots of daily death counts (a), daily mean temperatures (b), and diurnal temperature range (c), from January 2003 to 2007. Death counts aggregated over all Primary Sample Units (PSUs), temperature values and ranges depict nationwide spatial means. Red solid lines are derived through loess smoothers using an alpha of 0.1, red dotted lines from loess smoothers using an alpha of 0.25

