Figure 1.
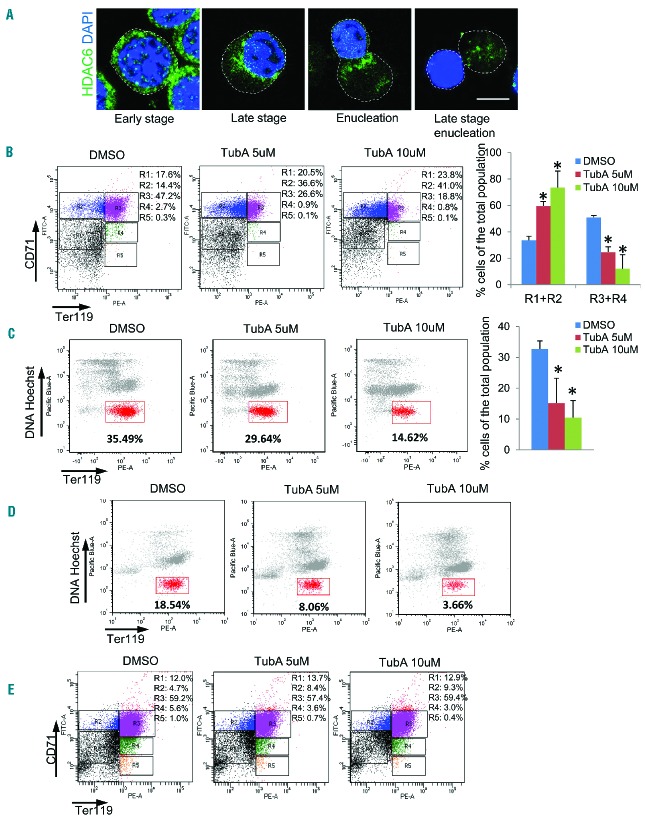
Inhibition of HDAC6 impairs cytokinesis and erythrocyte enucleation. (A) Confocal microscopy analysis of HDAC6 cellular distribution during Ter119-negative mouse fetal progenitor cell differentiation. The Ter119-negative erythroid progenitor cells were harvested from E13.5 mouse fetal livers, and cultured in vitro with erythropoietin for 24 h, and then the culture continued for an additional 24 h without erythropoietin. The cells were fixed at 0, 6 h, 12 h, and 48 h during the culture and immunostained with anti-HDAC6 conjugated with Alexa Fluor 488 and DAPI. Scale bar is 5 μm. The dashed line indicates the cell boundary. (B) Flow cytometric analysis of cultured Ter119-negative mouse fetal progenitors. DMSO, TubA (5 μM) or TubA (10 μM) was added at the time of erythropoietin induction and the cells were treated for 48 h. Cells were stained with Ter119 and CD71, and analyzed by FACS. The percentages of cells in an undifferentiated state (R1+R2) and differentiated state (R3+R4) were analyzed. (C) Flow cytometric analysis of induced Ter119-negative mouse fetal progenitors. DMSO, TubA (5 μM) or TubA (10 μM) was added at the time of erythropoietin induction and the cells were treated for 48 h. Cells were stained with Ter119 and Hoechst 33342, and analyzed by FACS. The percentage of the gated cells (Ter119-positive and Hoechst-negative cells), which represent the pool of enucleated reticulocytes, was analyzed. (D and E) DMSO, TubA (5 μM) or TubA (10 μM) was added 36 h after erythropoietin induction and the cells were treated for an additional 12 h. Cells were stained with (D) Ter119 and Hoechst 33342, or (E) Ter119 and CD71, and analyzed by FACS. The error bars represent mean +SD (n=3), *P<0.05 compared to DMSO treatment.

