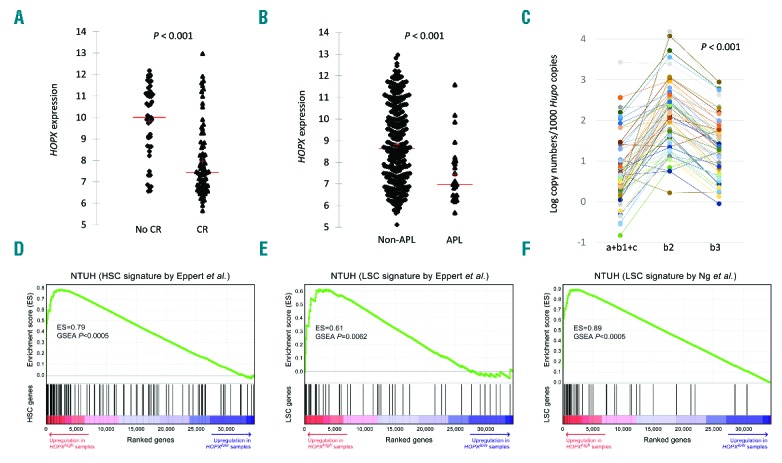
Figure 2.

HOPX expression levels, its correlation with treatment response, and its role as a stem cell marker by gene set enrichment analysis. (A) There was a significant difference in HOPX levels between patients with (n=166) and without (n=61) complete remission (CR) after induction chemotherapy. (B) HOPX expression is also much higher in non-APL patients. (C) Real-time PCR of HOPX in the cohort of 56 acute myeloid leukemia (AML) patients prospectively recruited showing predominant expression of isoform HOPXb2 (NM_139211) (left, isoforms a+b1+c; middle, b2; right, b3). (D, E, and F) GSEA plots of curated HSC and LSC signatures in the NTUH dataset.35,36 Red-to-indigo bars denote the genome-wide gene list ranked based on their P-values (t-test) between samples with high (top quartile) and low (bottom quartile) expression of HOPX. Significant positive GSEA enrichment scores indicate that HOPX expression is positively associated with HSC and LSC signatures.
