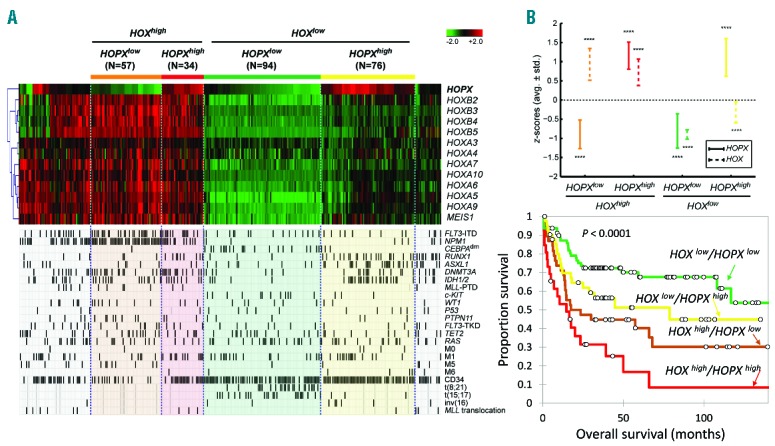
Figure 3.

Comparison of expression patterns, clinical and biological features among subgroups of NTUH AML patients based on hierarchical clustering of HOPX and HOX family genes. (A) Heatmap of HOPX and HOX family genes in NTUH data. We identify 4 groups of patients based on a 2-step hierarchical clustering: HOXhigh/HOPXlow by HOPXhigh/HOPXlow. Molecular and clinical variables including gene mutations, cytogenetic abnormalities, and leukemia classifications are compared among the clusters. (B) Average z-scores of HOPX and HOX genes in each group. Whiskers denote average±standard deviation of the z-scores. Statistical significance of the z-scores against zero is assessed by the 1-sample t-test (****P<0.0001). (C) Overall survival of the 4 groups of patients. HOXlow/HOPXlow patients have the best overall survival (OS), followed by HOXlow/HOPXhigh, HOXhigh/HOPXlow, and HOXhigh/HOPXhigh (P<0.001).
