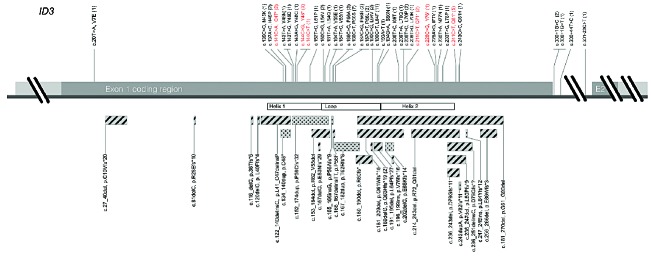
Figure 1.
ID3 gene plot with annotated mutations of the study cohort. ID3 coding region of exon 1 is illustrated with single base-pair substitutions on the upper and more complex alterations (insertions, deletions, InDels, duplications) on the lower site. Substitutions resulting in a nonsense mutation are depicted in red. Hatched bars delineate deletions and InDels, dotted bars characterize insertions and duplications. Each mutation is labeled with a correspondent description on the genomic and protein level, as well as the absolute number of occurrences in brackets. The functional helix-loop-helix domain is mapped according to UniProt (Q02535).

