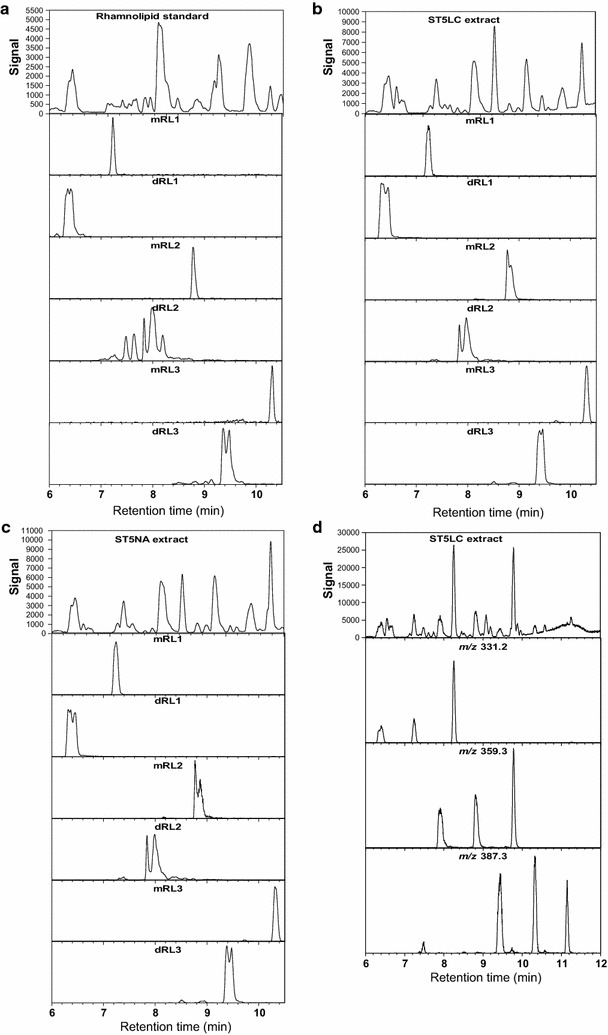
Fig. 5.

UPLC–MS profiles of rhamnolipid standard (a), ST5 glycerol-MSM liquid culture (ST5LC) extract (b) and ST5 nutrient agar surface culture (ST5NA) (c) showing the four major rhamnolipid groups. The top row profiles show the signal of positive molecular ions detected between 6 and 10 min. The profiles below each top row spectrum show the extracted spectra of the five rhamnolipid groups with RL1 = m/z 673.4, RL2 = m/z 645.3; RL3 = m/z 527.3 and RL4 = m/z 499.3. Profiles in d show the three types of HHAs (m/z 331.2, 359.3 and 387.3), either as precursors (third eluting peak) or fragments (first two eluting peaks) found in the ST5LC extract
