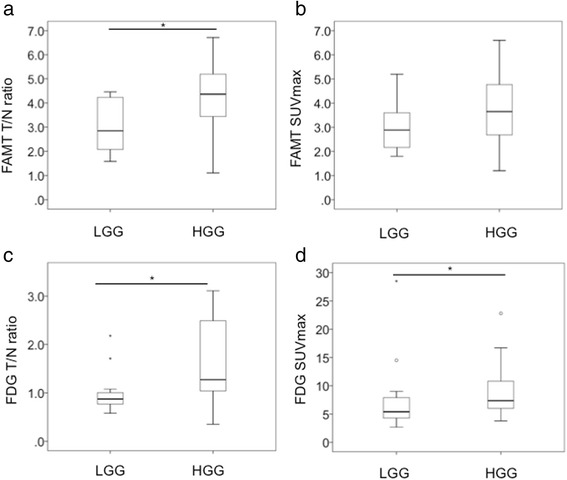
Fig. 1.

Box-and-whisker plots of 18F-FAMT and 8F-FDG uptake for LGG and HGG. a The difference in T/N ratio of 18F-FAMT uptake between LGG and HGG was significant (p = 0.006). b The difference in SUVmax of 18F-FAMT uptake between LGG and HGG was not significant (p = 0.087). c, d The differences in T/N ratio and SUVmax of 18F-FDG uptake between LGG and HGG were significant (p = 0.016 and p = 0.033, respectively)
