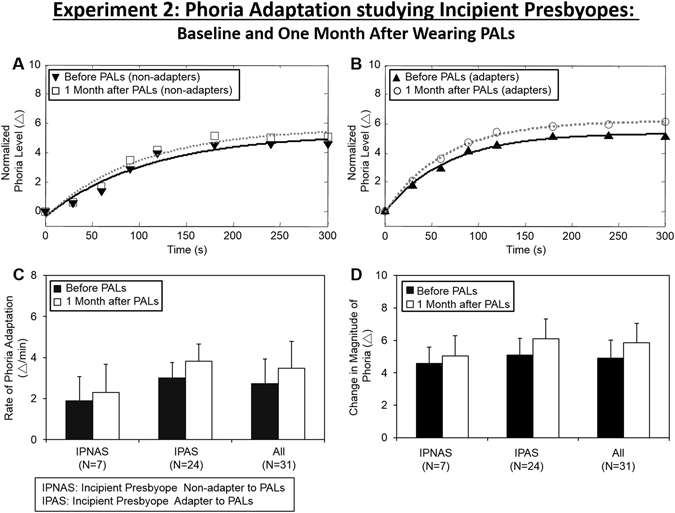
Figure 6.

(A) Normalized average rate of phoria adaptation and exponential fit of IPNAS group before (upside down triangle, black line) and one month after wearing PALs (open circle, gray line). (B) Normalized average rate of phoria adaptation and exponential fit of IPAS group before (triangle, black line) and one month after wearing PALs (open circle, gray line). Group level average and one standard deviation of the rate of phoria adaptation (C) and the change in magnitude of phoria adaptation (D) before (black bar) and one month after wearing PALs (white bar) of IPNAS, IPAS and all subjects.
