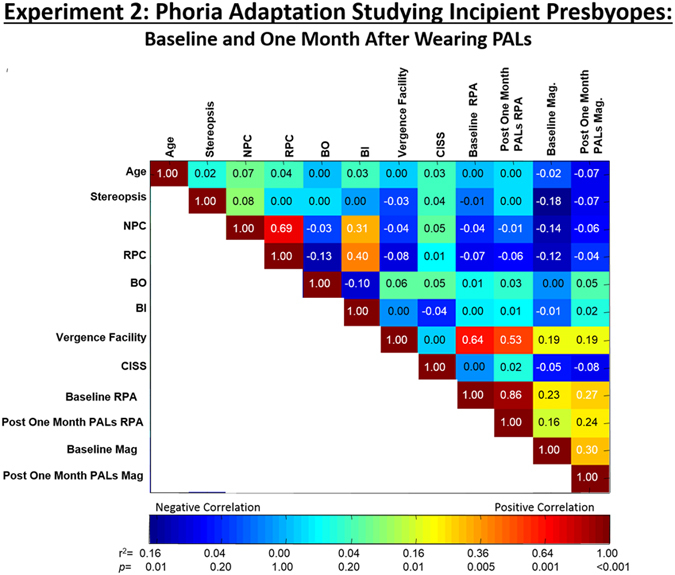
Figure 7.

Correlation and statistical significance analysis between all parameters measured during the data collection. Pearson’s correlation coefficient values (r2) are displayed in each bin. The color map shown below correspond to the r2 and p values. NPC: near point of convergence, RPC: recovery point of convergence, BO: base-out vergence range, BI: base-in vergence range, CISS: convergence insufficiency symptom survey score, RPA: rate of phoria adaptation, Mag: magnitude of change in phoria, Baseline: Before wearing PALs, Post One month after wearing PALs. Positive correlation is denoted in red and negative correlation is denoted in blue. Data are from Experiment 2 studying incipient presbyopes.
