
Figure 1.
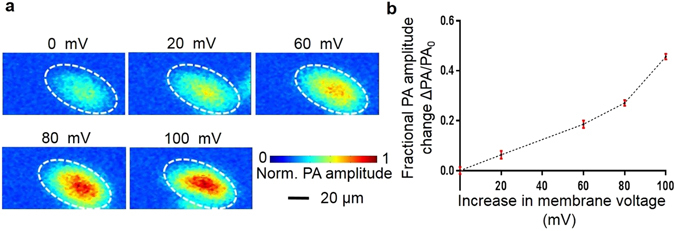
(a) Photoacoustic maximum-amplitude projection images of HEK-293 cells demonstrate photoacoustic signal changes due to cell membrane voltage changes. (b) Fractional photoacoustic signal change versus cell membrane resting voltage changes.
Official websites use .gov
A
.gov website belongs to an official
government organization in the United States.
Secure .gov websites use HTTPS
A lock (
) or https:// means you've safely
connected to the .gov website. Share sensitive
information only on official, secure websites.
(a) Photoacoustic maximum-amplitude projection images of HEK-293 cells demonstrate photoacoustic signal changes due to cell membrane voltage changes. (b) Fractional photoacoustic signal change versus cell membrane resting voltage changes.