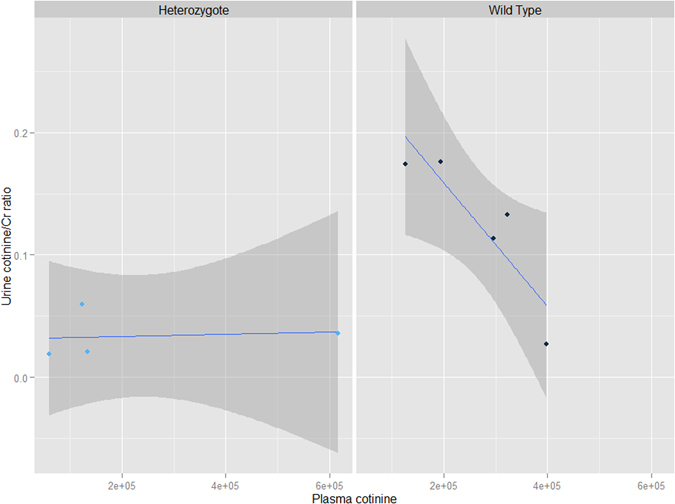
Figure 1.

Urinary and plasma cotinine levels by genotype. Urinary cotinine (normalized for creatinine concentration) relative to plasma cotinine in Hhip +/− heterozygotes (left panel) and Hhip +/+ wild type mice (right panel) subjected to chronic cigarette smoke. In Hhip +/+ wild type mice, a strong inverse correlation between urine and plasma cotinine levels exist (Pearson rho = −0.89, p-value = 0.04) whereas in Hhip +/− heterozygotes, no correlation was found (Pearson rho = 0.12, p-value = 0.88). The best fit line is plotted in blue while the 95% confidence interval is plotted in dark gray.
