
Figure 1.
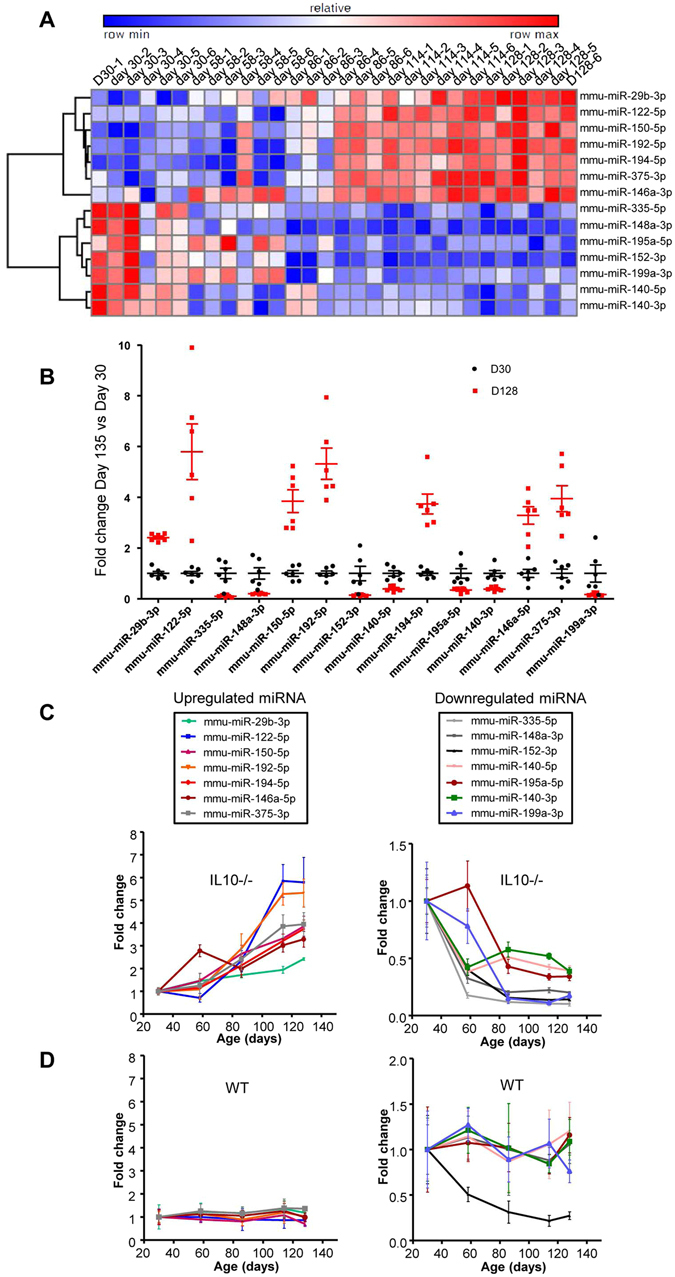
Serum miRNA profiles in a discovery cohort of IL10−/− mice. Sera were collected from IL10−/− mice at age 30, 58, 86, 114 and 128-days and subjected to miRNA profiling. (A) Hierarchical clustering showing the relative expression levels of the 14 deregulated miRNAs in each sample. (B) Expression profiles of miRNAs in colitic mice (D128) compared to the same mice before they develop colitis (D30). The average expression of each miRNA in non-colitic mice was set to 1. (C) Age-dependent representation of the expression profiles of the 14 deregulated miRNAs in the sera of IL10−/− mice. Seven were increased (left panel), and seven were decreased (right panel). (D) The expression levels of these differentially expressed miRNAs were analyzed in sera from WT mice. Data are given as the means +/− S.E.M. (n = 6).