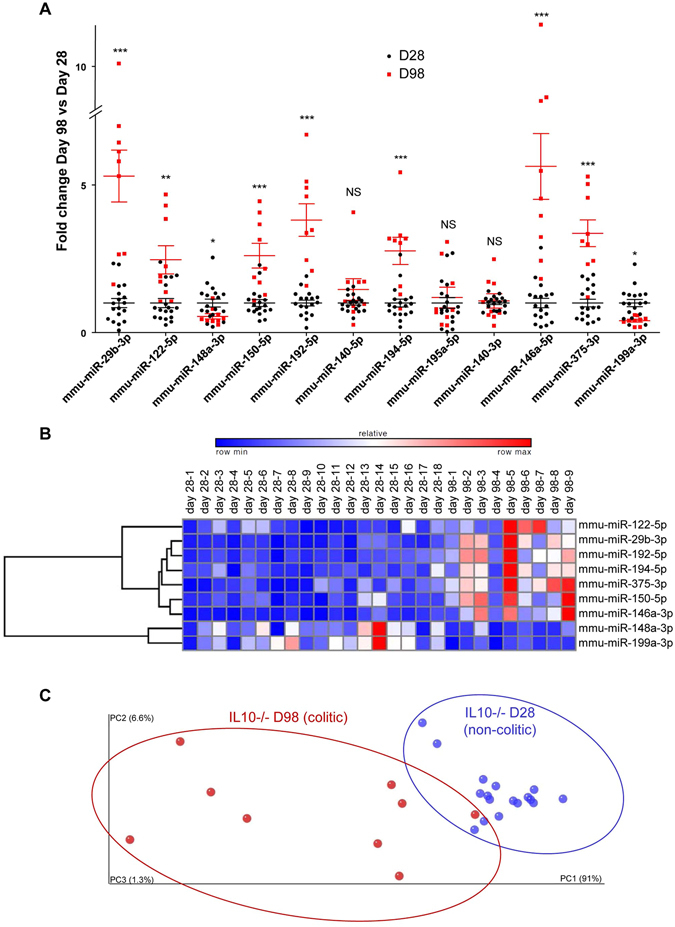
Figure 2.

Validation of a new miRNA signature for the assessment of colitis in a validation cohort of IL10−/− mice. The expression levels of 13 deregulated miRNAs were validated by qPCR using a second and independent set of IL10−/− mice. (A) Fold changes of the 12 expressed miRNAs in this new set of IL10−/− colitic mice (D98) compared to IL10−/− non-colitic mice (D28). The expression level of each miRNA was analyzed and standardized to 1 in non-colitic mice. (B) Hierarchical clustering showing the relative expression levels of the nine miRNAs in each sample. (C) Principal coordinate analysis (PCoA) plot of the euclidean distance matrix for miRNA expression in sera was performed using QIIME software and plotted using Emperor Software. Percentages on the axes indicate the percentage of variance explained by each component. The populations of the nine selected miRNAs in 28 day-old (blue) or 98 day-old (red) IL10−/− mice were clustered using normed PCoA. Permanova test, p = 0.001. Data are presented as the means +/− S.E.M. (n = 9–18). Significance was determined using unpaired t-test (*p < 0.05; **p < 0.01; ***p < 0.001; NS, not significantly different) compared to the results obtained from the corresponding D28 IL10−/− mice.
