
Figure 3.
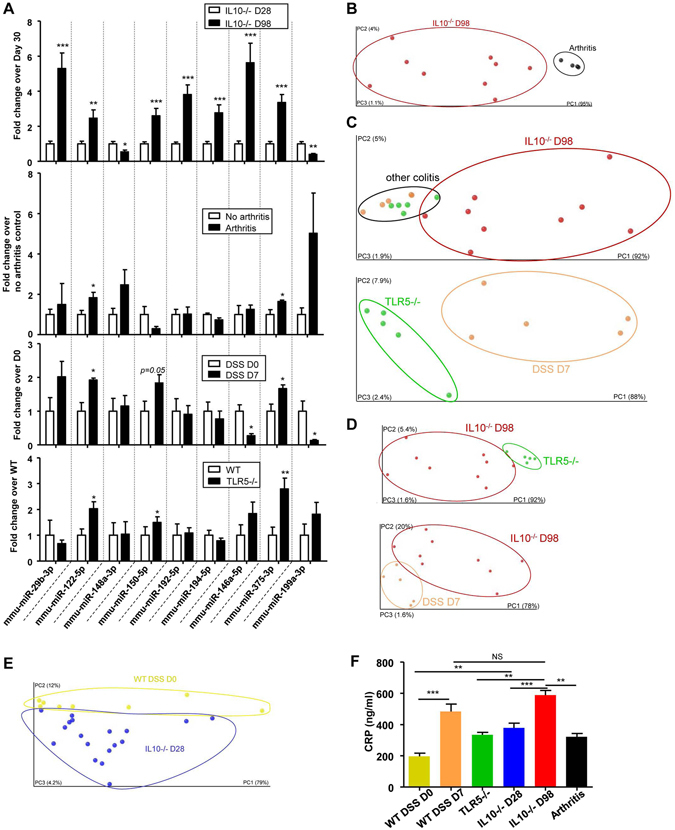
New miRNA signature specificity for intestinal inflammation and discrimination between different subtypes of colitis. Sera representing three different mouse models of colitis (IL10−/−, TLR5−/− and DSS-induced colitis) and arthritic mice were collected. (A) Fold changes of the nine signature miRNAs in IL10−/− (D98), arthritic (day 12) mice, 3% DSS-induced-colitic and TLR5−/−, compared to the relevant controls [28 day-old IL10−/− mice, Balb/C mice before the establishment of arthritis (day 2), water-control C57BL/6 WT mice and C57BL/6 WT mice]. (B–E) PCoA of the euclidean distance matrix of the 9 miRNA expression in sera of various mouse models was performed using QIIME software and plotted using Emperor Software. Percentages on the axes indicate the percentage of variance explained by each component. (B) IL10−/− mice at D98 (red) compared to sera of arthritic (black) mice; (C), IL10−/− colitic mice (day 98, red), TLR5−/− mice (green) and DSS-induced colitic mice (orange); (D), IL10−/− colitic mice on day 28 (blue) and D98 (red) compared to TLR5−/− and DSS-induced colitic mice; and (E) IL10−/− mice at D28 (blue) compared to WT water-treated control mice (DSS D0, yellow). (F) CRP levels were measured in the sera of WT, D7 DSS, TLR5−/−, D28 IL10−/−, D98 IL10−/− and arthritic mice. Data are presented as the means +/− S.E.M. (n = 5–18). Significance was determined using unpaired t-test (A) or using One-way ANOVA followed by a Bonferroni post-test (F) (*p < 0.05; **p < 0.01; ***p < 0.001; and NS, not significantly different) compared to the corresponding non-inflamed controls.