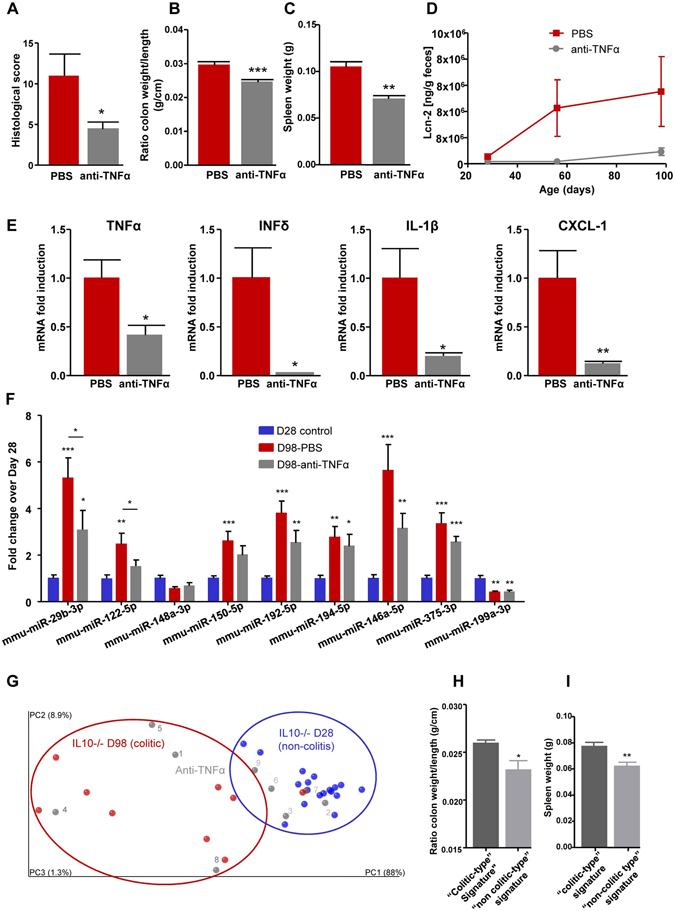
Figure 5.

The miRNA signature in the evaluation of therapeutic response. IL10−/− mice were treated by IP injection of anti-TNFα antibodies at a dose of 10 mg/kg two times per week for 10 weeks. (A) Histological scores were measured from H&E-stained colons (Fig. S7A). (B–D), spleen weight (B), ratio of colon weight/colon length (C), and fecal Lcn-2 (D) were measured. (E) Total RNAs were extracted from colons, and the expression levels of TNFα, IFN-δ, IL-1β and KC were quantified by qPCR and normalized with respect to 36B4. (F) The fold changes of the nine signature miRNAs were quantified by qPCR in the sera of IL10−/− mice. (G) PCoA of the euclidean distance matrix of miRNA expression in sera from D28 IL10−/− mice (blue), D98 IL10−/− PBS-treated (red) and day 98 IL10−/− anti-TNFα-treated (gray) mice. Percentages on the axes indicate the percentage of variance explained by each component. (H,I) ratios of colon weights/colon lengths (H) and spleen weights (I) of mice with the colitic-type signature (dark gray) and non-colitic-type signature (light gray) are displayed as bar graphs. Data are presented as the means +/− S.E.M. (n = 9). Significance was determined using an unpaired t-test (A,B,C,E,H,I and J) or One-way ANOVA followed by a Bonferroni post-test (F) (*p < 0.05; **p < 0.01; ***p < 0.001) compared to the day 98 IL10−/− PBS control group (A–E) or day 28 IL10−/− control group (F).
