
Figure 6.
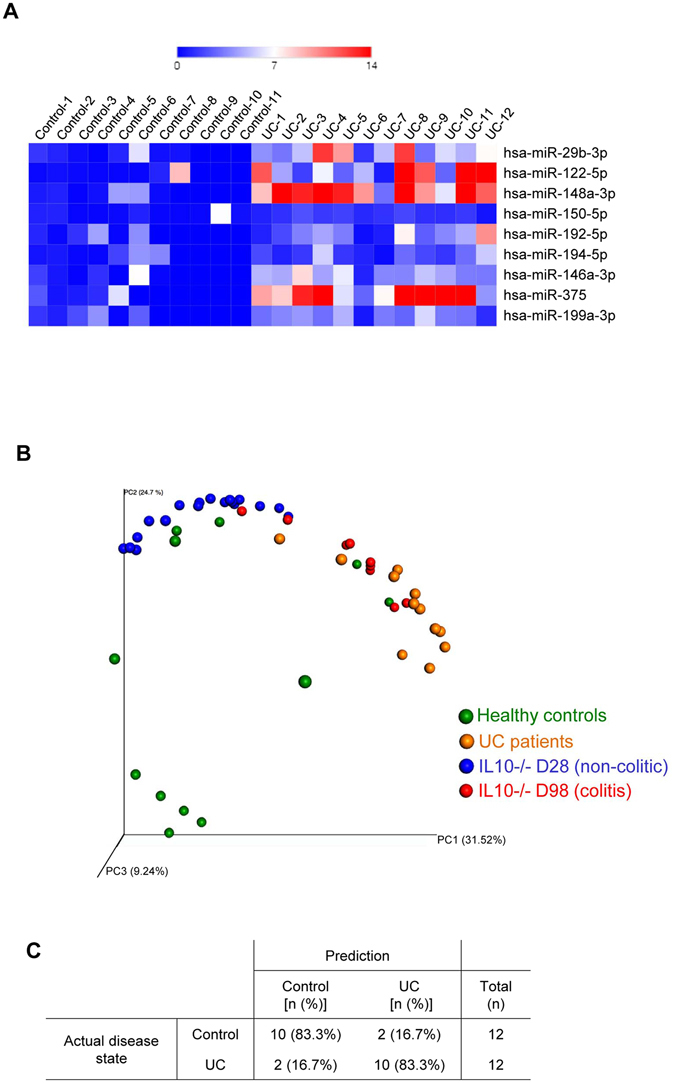
miRNA signature in UC patients. The expression levels of 9 deregulated miRNAs were assesses by qPCR in UC patients. (A) Heatmap showing the relative fold changes over controls of the 9 miRNAs in each sample. (B) PCoA of the bray curtis distance of miRNA expression in sera from non-colitic mice (in blue), colitic mice (in red), Ulcerative colitis (UC) patients and healthy control. (C) kNN (k-Nearest Neighbour) classifier were applied using mice samples (both colitic and non colitic) as discovery cohort and human samples (both UC and controls) as test cohort. Prediction rates of disease state using the previously identified miRNA signature is shown.