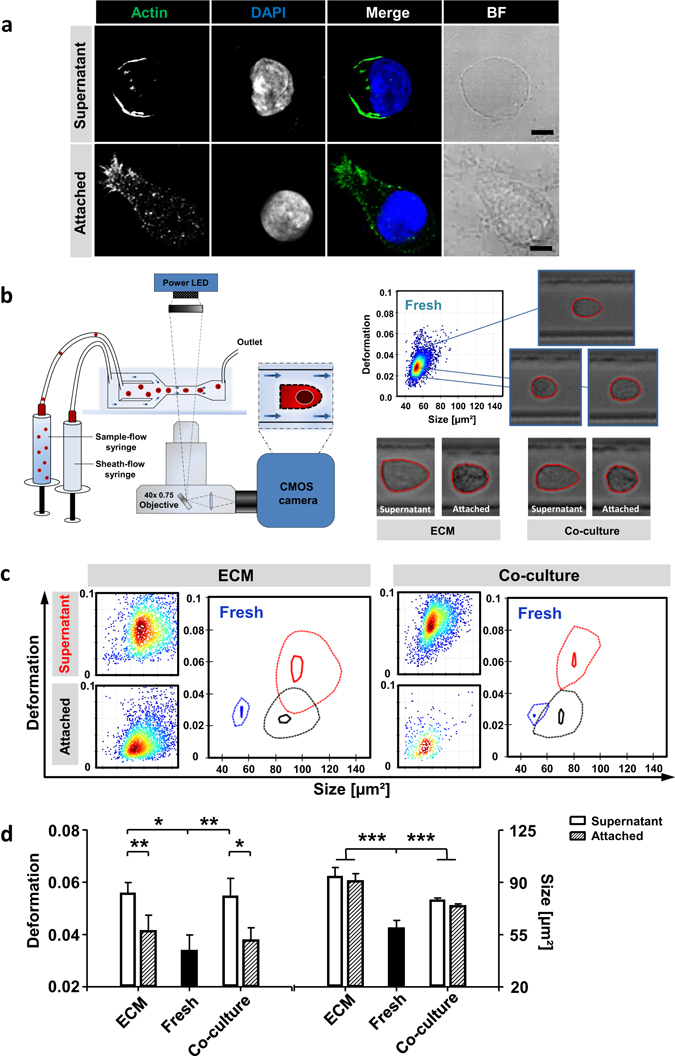
Figure 2.

HSPC adhesion to ECM-proteins remodel morphological and mechanical phenotype. (a) Confocal microscopy single z-slice images of actin cytoskeleton using phalloidin-488 (green) staining and nuclei DAPI (blue) staining. Bars = 5 µm. (b) Schema shows an overview of RT-DC set-up. Representative heat-plot of RT-DC measurement was recorded directly after MACS isolation of fresh CD34+ cells. Representative images of cells in microfluidic channel constriction of fresh, ECM or MSC co-cultured cells. (c) Representative heat-plots of cell-size and cell-deformation of AT- and SN-cells either ECM- or MSC co-cultured. Contour-plots compare freshly isolated cells (blue), AT-cells (black) and SN-cells (red). The solid inner line highlights 95% and the dashed outer line 50% density. Cells measured after a 5 day cultivation period. (d) Statistical analyses of deformation and cell-size measured in RT-DC of fresh cells and ECM- or MSC co-cultured cells. n = 5, linear mixed model analysis, Error bars, SD.; *p < 0.05, **p < 0.01, ***p < 0.001.
