Figure 5.

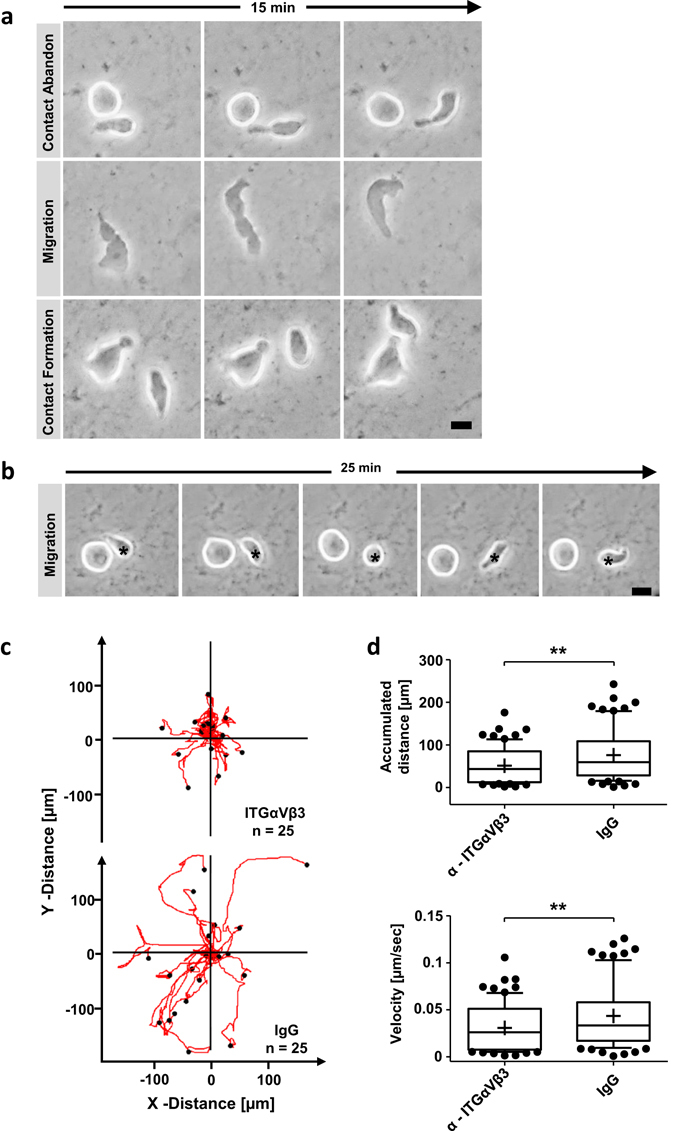
Blocking ITGαVβ3 attenuates migration of HSPCs. (a) Individual frames of 15 minutes time-laps microscopy studies of migrating and interacting cells on ECMs. Bar = 5 µm. (b) Individual frames of 25 minutes time-laps microscopy of a non-migrating cell and a migrating cell forming no-migrating phenotype (asterisk). Bar = 5 µm. (c) Cells were cultured 5 days on ECMs and incubated one hour with α-ITGαVβ3 or IgG. Trajectory plots depict migration of 25 HSPCs for 45 minutes. (d) Box-and-whiskers plots presenting accumulated distance and velocity of 77 HSPCs migration tracks monitored for 45 minutes pre-incubated 1 hour with α-ITGαVβ3 or IgG. Lines show 25th – 75th percentiles, horizontal line represents median and plus represents mean value. two-tailed t-test.; *p < 0.05, **p < 0.01, ***p < 0.001.
