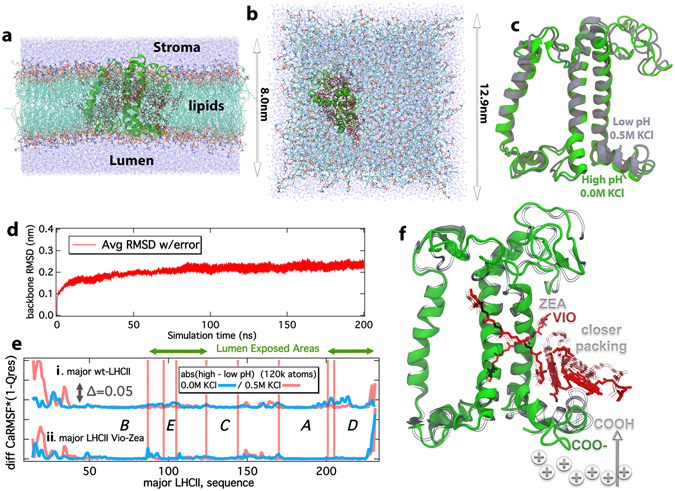
Figure 3.

Simulations employing large membrane patches and a proposed model for the response of LHCs under NPQ conditions. (a,b) Side and Top views of the large membrane systems, with dimensions indicated. Water is shown in blue dots, lipid tails in light gray and lipid heads in red (oxygen) – blue (nitrogen). The protein matrix is shown in green cartoons, carotenoids in red and chlorophylls in dark gray. (c) Average structures out of the cluster averaging (400 ns per sample) for the high pH (0.0 M KCl) (green) and low pH (0.5 M KCl) (ice blue) states. (d) The average backbone Root mean Square Deviation (RMSD) in nm for all major LHCII (spinach) large membrane structures (400 ns cumulative sampling time per sample). (e) The product of Ca-RMSF * (1-Qres) in absolute high minus low pH difference in the presence (red) or in the absence (blue) of a Δ(KCl). The peaks indicate regions of high flexibility and distinct structural conformation for the major LHCII (spinach) in a large membrane patch and 400 ns cumulative sampling time per sample. (f) Schematic overview of the proposed response of the antenna complexes of Photosystem II, under NPQ conditions. Solid colors represent relaxing states (light harvesting), whereas transparent/gray colors represent a potential energy dissipating state (quenching), based on the major LHCII (spinach) response to ΔpH/Δ(KCl). Different scaling has been used for the cartoons (green, helices-residues) and the pigments (red) for clarity.
