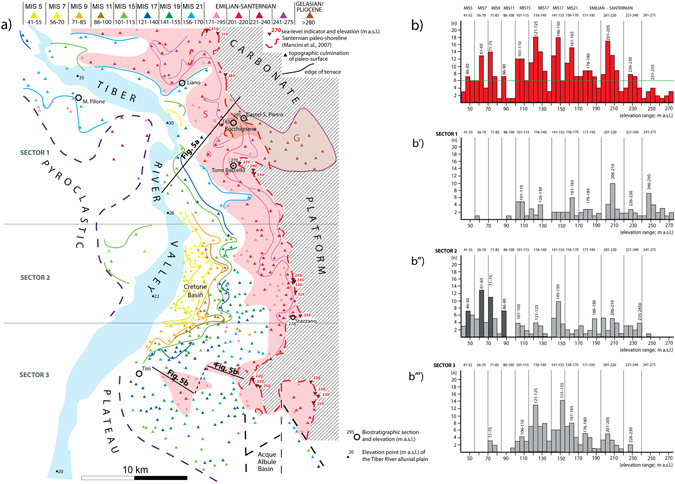
Figure 4.

Geomorpholoic map and statistics. Map hand drawn with Adobe© Illustrator CS3 13.0.0 graphic program. (a) Geomorphologic map of the Tyrrhenian Sea margin of Latium in the area adjacent to the paleo-shoreline indicators (red triangles with downward vertex) of the Santernian coastline (red dashed line10). A series of terraced surfaces is reconstructed following criteria established in ref. 12 and described in the text, from a dataset of topographic culminations (colored triangles with upward vertex); the colored lines are the inner margin of terrace. The red shaded area represents the oldest paleo-surface corresponding to the top of the continental deposits of late Santernian-Emilian age. (b) Histograms reporting distribution and peaks of concentration for the topographic culminations, for three different geographic sectors (b′–b″–b′′′) and for the total area (b). A series of classes of elevation, identifying the same number of paleo-surfaces are recognized and correlated with the sea-level highstands of marine isotopic stages (MISs), following criteria described in the text. Location of the investigated paleontological sites, the sedimentary sections and the two cross-section of Fig. 5 is shown.
